EIDORS
(mirror)
Main
Documentation
Tutorials
− Image Reconst
− Data Structures
− Applications
− FEM Modelling
− GREIT
− Old tutorials
− Workshop
Download
Contrib Data
GREIT
Browse Docs
Browse SVN
News
Mailing list
(archive)
FAQ
Developer
Hosted by

| |
EIT-based regional lung mechanics in the acute respiratory distress syndrome during lung recruitment (human)
Methods and Data
The EIT data were collected at Children's Hospital Boston in 2009 during a stepwise lung recruitment manoeuver and positive end-expiratory pressure (PEEP) titration of a patient with the acute respiratory distress syndrome as part of a clinical study described in the following two papers:
-
C Gómez-Laberge, JH Arnold, GK Wolf.
A Unified Approach for EIT Imaging of Regional Overdistension and Atelectasis in Acute Lung Injury
IEEE Trans Med Imag, In Press 2012
-
GK Wolf, C Gómez-Laberge, JN Kheir, D Zurakowski, BK Walsh, A Adler, JH Arnold.
Reversal of Dependent Lung Collapse Predicts Response to Lung Recruitment in Children
with Early Acute Lung Injury
Pediatr Crit Care Med, In Press 2012
EIDORS Analysis
- Go to the
Data Contrib section, and
download the
data and save it to your working directory.
- Go to the
Data Contrib section, and
download the
code and save it to your working directory.
At this point, you should have 27 *.m files in the directory, and a directory structure
'DATA/STUDYNAME/SUBJECT_1/YYYYMMDD/Eit/Viasys' containing 9 *.get files.
- Reconstruct images for each step of the protocol and save images
% PROCESS EACH STEP OF THE PROTOCOL
basename = './DATA';
filename = 'STUDYNAME/SUBJECT_1/YYYYMMDD/Eit/Viasys/1001_b.get';
range =[]; maneuver='increment'; PEEP=14; dP=5;
process_and_save(basename, filename, range, maneuver, PEEP, dP);

filename = 'STUDYNAME/SUBJECT_1/YYYYMMDD/Eit/Viasys/1001_c1.get';
range =[]; maneuver='increment'; PEEP=15; dP=15;
process_and_save(basename, filename, range, maneuver, PEEP, dP);

filename = 'STUDYNAME/SUBJECT_1/YYYYMMDD/Eit/Viasys/1001_c2.get';
range =[]; maneuver='increment'; PEEP=20; dP=15;
process_and_save(basename, filename, range, maneuver, PEEP, dP);

filename = 'STUDYNAME/SUBJECT_1/YYYYMMDD/Eit/Viasys/1001_c3.get';
range =[]; maneuver='increment'; PEEP=25; dP=15;
process_and_save(basename, filename, range, maneuver, PEEP, dP);

filename = 'STUDYNAME/SUBJECT_1/YYYYMMDD/Eit/Viasys/1001_c4.get';
range =[]; maneuver='increment'; PEEP=30; dP=15;
process_and_save(basename, filename, range, maneuver, PEEP, dP);

filename = 'STUDYNAME/SUBJECT_1/YYYYMMDD/Eit/Viasys/1001_d1.get';
range =[1,765]; maneuver='decrement'; PEEP=20; dP=6;
process_and_save(basename, filename, range, maneuver, PEEP, dP);

filename = 'STUDYNAME/SUBJECT_1/YYYYMMDD/Eit/Viasys/1001_d2.get';
range =[]; maneuver='decrement'; PEEP=18; dP=6;
process_and_save(basename, filename, range, maneuver, PEEP, dP);

filename = 'STUDYNAME/SUBJECT_1/YYYYMMDD/Eit/Viasys/1001_d3.get';
range =[368,780]; maneuver='decrement';  PEEP=16; dP=5;
process_and_save(basename, filename, range, maneuver, PEEP, dP);

filename = 'STUDYNAME/SUBJECT_1/YYYYMMDD/Eit/Viasys/1001_d4.get';
range =[411,780]; maneuver='decrement'; PEEP=14; dP=4;
process_and_save(basename, filename, range, maneuver, PEEP, dP);
- Display time signal and images from one step
%% SHOW EXAMPLE RESULTS FROM ONE STEP
load SUBJECT_1-c1.mat
EITCalcTimeSignal(db_c1.eitdata);
EITCalcFrequencySpectrum(db_c1.eitdata);
EITDisplayImages(db_c1.eitimages);
EITDisplayImages(db_c1.eitimages,1,'mtd');
% :clear
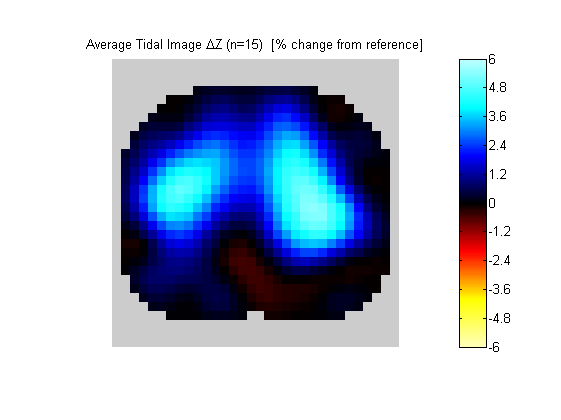
Figure 1:
Output of "EITDisplayImages(db_c1.eitimages,1,'mtd');". An estimate regional tidal ventilation.
- Aggregate data from all recruitment maneuver steps
close all
load SUBJECT_1-b.mat
load SUBJECT_1-c1.mat
load SUBJECT_1-c2.mat
load SUBJECT_1-c3.mat
load SUBJECT_1-c4.mat
load SUBJECT_1-d1.mat
load SUBJECT_1-d2.mat
load SUBJECT_1-d3.mat
load SUBJECT_1-d4.mat
clear matname
vars = who('db_*');
aggLungROI = eval([vars{1} '.eitimages.lungROI;']);
for i = 2:length(vars)
    aggLungROI = aggLungROI | eval([vars{i} '.eitimages.lungROI;']);
end
for i = 1:length(vars)
    eval([vars{i} '.eitimages.lungROI = aggLungROI;']);
    eval([vars{i} ...
        '.eitimages = EITCalcComplianceImage(' vars{i} '.eitimages);']);
end
clear i
limb_index = {'b','c1','c2','c3','c4'};

eitimages = eval(['db_' limb_index{1} '.eitimages']);
image_mask = eitimages.image_mask;
lungROI = eitimages.lungROI;
lindex = length(limb_index);
[row,col] = size(image_mask);
C = zeros(row,col,lindex);
pressure = zeros(lindex,1);
for i = 1:lindex
    C(:,:,i) = eval(['db_' limb_index{i} '.eitimages.complianceimage']);
    pressure(i) = eval(['db_' limb_index{i} '.eitimages.peep;']);
end
Ctab = TabulateImageData(C,image_mask);
lungROItab = TabulateImageData(lungROI,image_mask);
Ctab(lungROItab==0,:) = [];

Cmax = zeros(row,col);
Ctab = TabulateImageData(C,image_mask);
[Cmaxtab,index] = TabulateImageData(Cmax,image_mask);
Pstartab = Cmaxtab;
for i = 1:size(Ctab,1)
    if isinf(Ctab(i,1))
        Cmaxtab(i) = -Inf;
        Pstartab(i) = -Inf;
    else
        tempc = Ctab(i,:);
        cmax = max(tempc);
        pstaridx = find(tempc==cmax,1);
        pstar = eval(['db_' limb_index{pstaridx} '.eitimages.peep']);
        Cmaxtab(i)=cmax;
        Pstartab(i)=pstar;
    end
end
Cmax = ImageTableData(Cmaxtab,[row col],index);
Cmax(~image_mask) = -Inf;
Pstar = ImageTableData(Pstartab,[row col],index);
Pstar(~image_mask) = -Inf;
eitimages.Cmax  = Cmax;
eitimages.Pstar = Pstar;
for i = 1:lindex
    eval(['db_' limb_index{i} '.eitimages = EITCalcLungState(db_' ...
        limb_index{i} '.eitimages,Cmax,Pstar);']);
end
- Display C_MAX and P_STAR maps
EITDisplayImages(eitimages,1,'Cmax')
EITDisplayImages(eitimages,1,'Pstar')
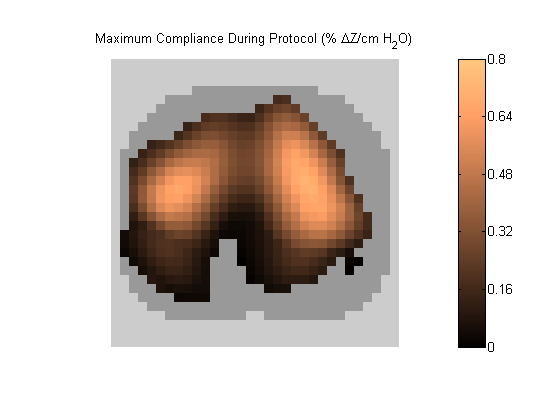
Figure 2:
C_MAX map represents each pixel's maximum compliance during the recruitment manoeuvre. Grey pixels represent extrapulmonary tissue excluded during ROI analysis in step 4.
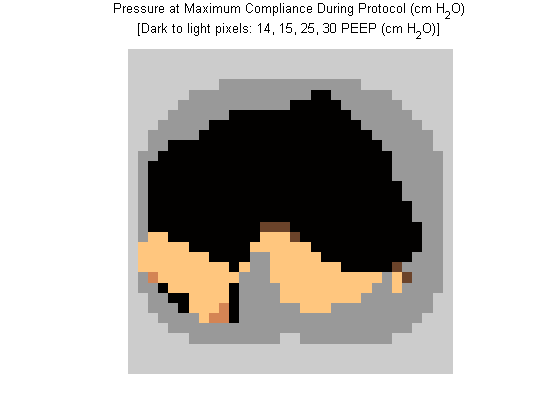
Figure 3:
P_STAR map indicates the pressure at which maximum compliance was achieved during lung recruitment. Black pixels were most compliant at 14 cm of water, while brightest pixels were most compliant at 30 cm of water. Grey pixels represent extrapulmonary tissue.
- Display lung overdistension (blue) and collapse (red) maps
close all
for i = 1:lindex
    EITDisplayImages(eval(['db_' limb_index{lindex-i+1} '.eitimages']),1,'collapseOD');
end
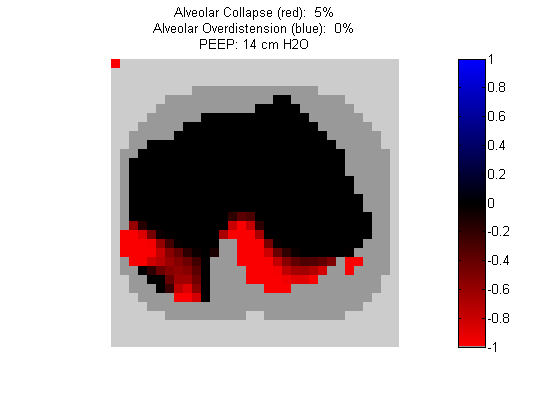
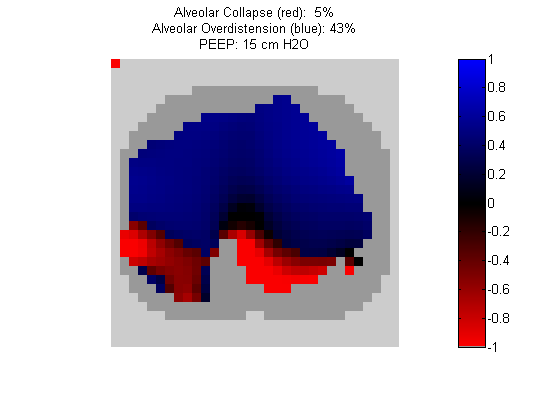
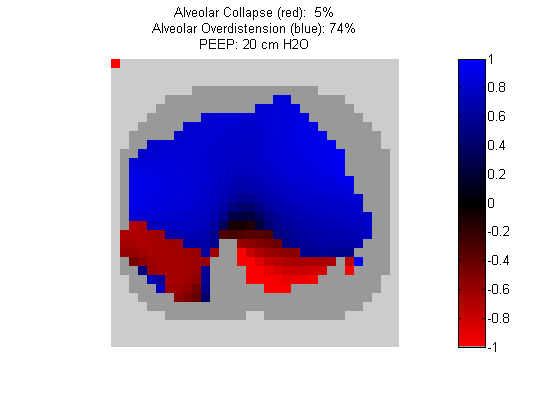
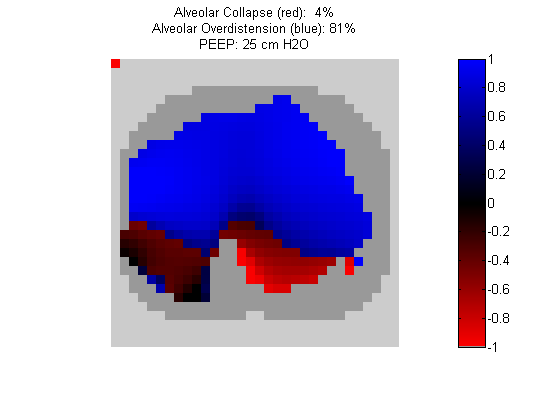
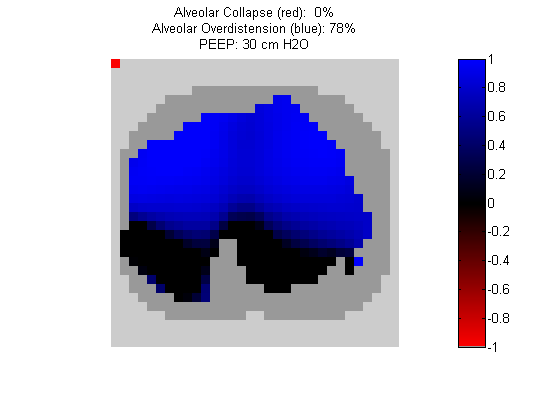
Figure 4:
Regional overdistension (blue) and collapse (red) maps during lung recruitment. Grey pixels represent extrapulmonary tissue.
- Repeat steps 4-6 for PEEP titration manoeuvre: aggregate data from titration steps
close all
clear
load SUBJECT_1-b.mat
load SUBJECT_1-c1.mat
load SUBJECT_1-c2.mat
load SUBJECT_1-c3.mat
load SUBJECT_1-c4.mat
load SUBJECT_1-d1.mat
load SUBJECT_1-d2.mat
load SUBJECT_1-d3.mat
load SUBJECT_1-d4.mat
clear matname
vars = who;
aggLungROI = eval([vars{1} '.eitimages.lungROI;']);
for i = 2:length(vars)
    aggLungROI = aggLungROI | eval([vars{i} '.eitimages.lungROI;']);
end
for i = 1:length(vars)
    eval([vars{i} '.eitimages.lungROI = aggLungROI;']);
    eval([vars{i} ...
        '.eitimages = EITCalcComplianceImage(' vars{i} '.eitimages);']);
end
clear i

limb_index = {'d1','d2','d3','d4'};

eitimages = eval(['db_' limb_index{1} '.eitimages']);
image_mask = eitimages.image_mask;
lungROI = eitimages.lungROI;
lindex = length(limb_index);
[row,col] = size(image_mask);
C = zeros(row,col,lindex);
pressure = zeros(lindex,1);
for i = 1:lindex
    C(:,:,i) = eval(['db_' limb_index{i} '.eitimages.complianceimage']);
    pressure(i) = eval(['db_' limb_index{i} '.eitimages.peep;']);
end
Ctab = TabulateImageData(C,image_mask);
lungROItab = TabulateImageData(lungROI,image_mask);
Ctab(lungROItab==0,:) = [];

Cmax = zeros(row,col);
Ctab = TabulateImageData(C,image_mask);
[Cmaxtab,index] = TabulateImageData(Cmax,image_mask);
Pstartab = Cmaxtab;
for i = 1:size(Ctab,1)
    if isinf(Ctab(i,1))
        Cmaxtab(i) = -Inf;
        Pstartab(i) = -Inf;
    else
        tempc = Ctab(i,:);
        cmax = max(tempc);
        pstaridx = find(tempc==cmax,1);
        pstar = eval(['db_' limb_index{pstaridx} '.eitimages.peep']);
        Cmaxtab(i)=cmax;
        Pstartab(i)=pstar;
    end
end
Cmax = ImageTableData(Cmaxtab,[row col],index);
Cmax(~image_mask) = -Inf;
Pstar = ImageTableData(Pstartab,[row col],index);
Pstar(~image_mask) = -Inf;
eitimages.Cmax  = Cmax;
eitimages.Pstar = Pstar;
for i = 1:lindex
    eval(['db_' limb_index{i} '.eitimages = EITCalcLungState(db_' ...
        limb_index{i} '.eitimages,Cmax,Pstar);']);
end
- Display C_MAX and P_STAR maps
EITDisplayImages(eitimages,1,'Cmax')
EITDisplayImages(eitimages,1,'Pstar')
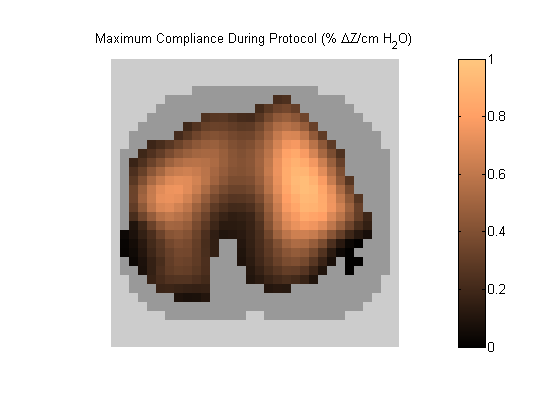
Figure 5:
C_MAX map represents each pixel's maximum compliance during the PEEP titration. Grey pixels represent extrapulmonary tissue.
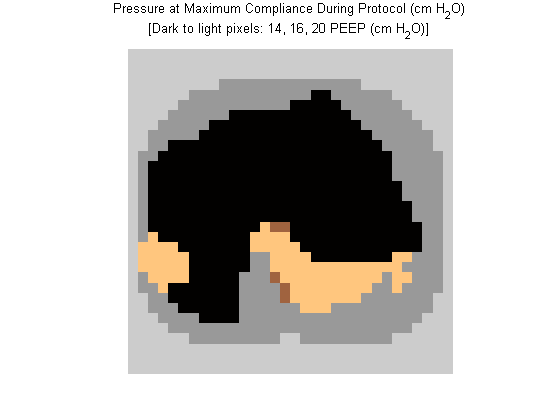
Figure 6:
P_STAR map indicates the pressure at which maximum compliance was achieved during PEEP titration. Black pixels were most compliant at 14 cmH2O, while brightest pixels were most compliant at 20 cmH2O. Grey pixels represent extrapulmonary tissue.
- Display lung overdistension (blue) and collapse (red) maps
close all
for i = 1:lindex
    EITDisplayImages(eval(['db_' limb_index{lindex-i+1} '.eitimages']),1,'collapseOD');
end

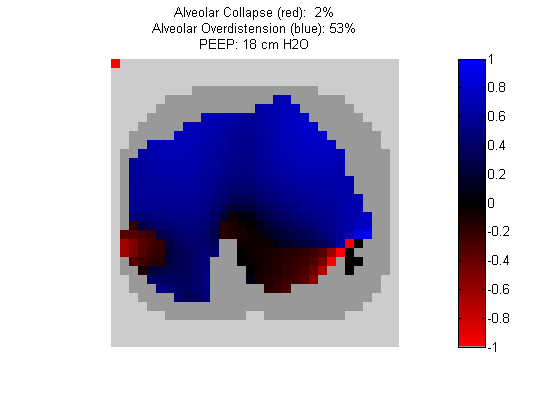
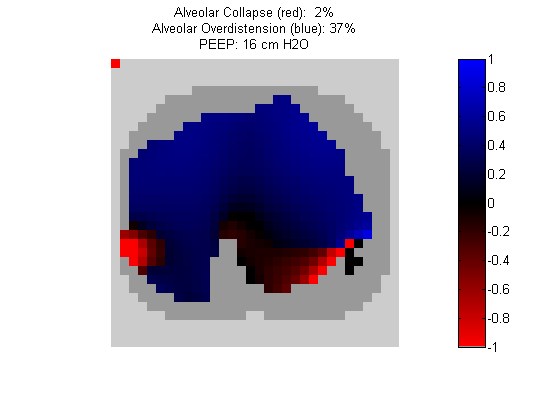
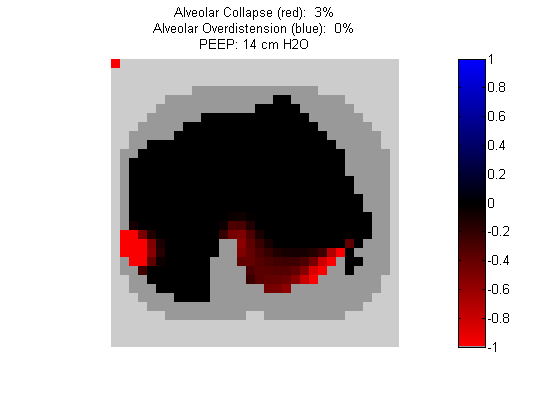
Figure 7:
Regional overdistension (blue) and collapse (red) maps during PEEP titration. Grey pixels represent extrapulmonary tissue.
|