|
|
EIDORS: Electrical Impedance Tomography and Diffuse Optical Tomography Reconstruction Software |
|
EIDORS
(mirror) Main Documentation Tutorials − Image Reconst − Data Structures − Applications − FEM Modelling − GREIT − Old tutorials − Workshop Download Contrib Data GREIT Browse Docs Browse SVN News Mailing list (archive) FAQ Developer
Hosted by |
FEM accuracy vs model sizeTo roughly test relative accuracy, we start with a very fine FEM model (and assume it to be accurate).WARNING: Don't try this at home. Only the first model takes over an hour, 50 GB of memory and 8 CPUs.
h= 10/2; w = 28; % Simulate tank of 30cm hight, 28cm width
stim= mk_stim_patterns(16,1,[0,1],[0,1],{},1); % Sheffield pattern
elec_sz = [0.2,0,0.05];   % electrode radius 0.5cm; 1cm diameter.

maxsz = .15;
fmdl = ng_mk_cyl_models([2*h,w/2,maxsz],[16,h],elec_sz);
fmdl.stimulation = stim;

vr = fwd_solve(mk_image(fmdl,1)); % solve homogeneous model
vr.n_ne = [size(fmdl.nodes,1), size(fmdl.elems,1)];
We then create
coarser models, and compare the relative accuracy in EIT
data measurements between models.
maxsz = [8,4,3,2,1.5,1.3,1.2,1.1,1,.9,0.8,0.7,0.6,0.5,0.45,0.4,0.35,0.3,0.28,0.26,.25,.24,.23,.22,.21,.20,.19,.18,.17,.16];
%maxsz = [8,4,3,2,1,0.8,0.7];
for i=1:length(maxsz)
   fmdl = ng_mk_cyl_models([2*h,w/2,maxsz(i)],[16,h],elec_sz);
   fmdl.stimulation = stim;
   vh = fwd_solve(mk_image(fmdl,1));
   vh.n_ne = [size(fmdl.nodes,1), size(fmdl.elems,1)];
   vv(i) = vh;
end
The relative error is calculated as the absolute of (vcourse/vfine − 1).
for i=1:length(maxsz);
   dv(:,i) = vv(i).meas ./ vr.meas  - 1;
   disp([i, maxsz(i), 1e3*mean(abs(dv(i,:))), vv(i).n_ne/1e4]);
   n_ne(i,:) = vv(i).n_ne;
end

loglog(maxsz,mean(abs(dv)),'*-');
xlabel('Maximum element size');
ylabel('Relative error');
grid
print_convert netgen_accuracy03a.png '-density 75'

loglog(n_ne(:,1),mean(abs(dv)),'*');
xlabel('Number of nodes');
ylabel('Relative error');
grid on
print_convert netgen_accuracy03b.png '-density 75'

loglog(n_ne(:,2),mean(abs(dv)),'*');
xlabel('Number of elements');
ylabel('Relative error');
grid on
print_convert netgen_accuracy03c.png '-density 75'
      i       maxsz   1e3*error #nodes/1e4 #elems/1e4
    1.0000    8.0000    7.9558    0.9095    4.0884
    2.0000    4.0000    8.5508    0.9021    4.0426
    3.0000    3.0000    7.3548    0.9101    4.0775
    4.0000    2.0000    4.4607    0.9339    4.1812
    5.0000    1.5000    2.6622    1.0268    4.5968
    6.0000    1.3000    2.5278    1.0799    4.7807
    7.0000    1.2000    2.7691    1.4368    7.4770
    8.0000    1.1000    2.6421    1.4898    7.7080
    9.0000    1.0000    0.8140    1.5298    7.1152
   10.0000    0.9000    0.8350    1.7002    7.9016
   11.0000    0.8000    0.7083    2.2692   10.9423
   12.0000    0.7000    0.7342    2.3332   11.0094
   13.0000    0.6000    0.3399    3.2216   15.6624
   14.0000    0.5000    0.3268    6.5616   34.5212
   15.0000    0.4500    0.2649    7.1027   36.8755
   16.0000    0.4000    0.2913   11.9885   64.1146
   17.0000    0.3500    0.4348   14.5644   86.6994
   18.0000    0.3000    0.1766   17.5866   94.7772
   19.0000    0.2800    0.1726   18.1879   97.2358
   20.0000    0.2600    0.2149   18.7605   99.0547
   21.0000    0.2500    0.2162   43.2111  242.2489
   22.0000    0.2400    0.2349   46.8521  262.4490
   23.0000    0.2300    0.1493   46.8355  261.5192
   24.0000    0.2200    0.1651   47.3970  263.6308
   25.0000    0.2100    0.1707   59.8964  335.1454
   26.0000    0.2000    0.1061   88.0420  494.9801
   27.0000    0.1900    0.2024   90.0918  504.3220
   28.0000    0.1800    0.1521   71.1429  397.4208
   29.0000    0.1700    0.2003   87.7859  493.0194
   30.0000    0.1600    0.1357  100.5216  566.3516
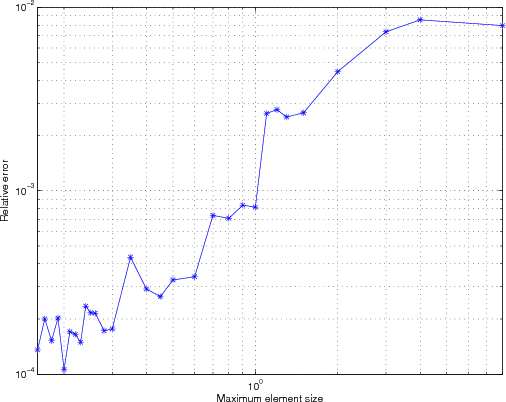
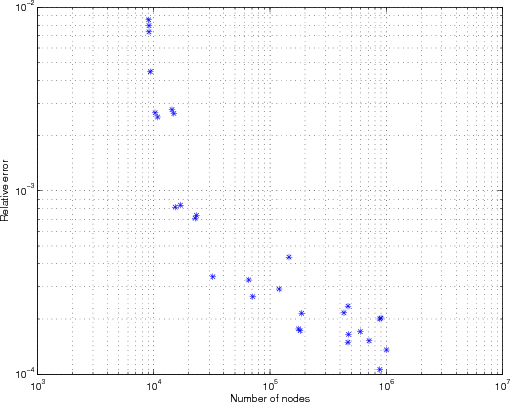
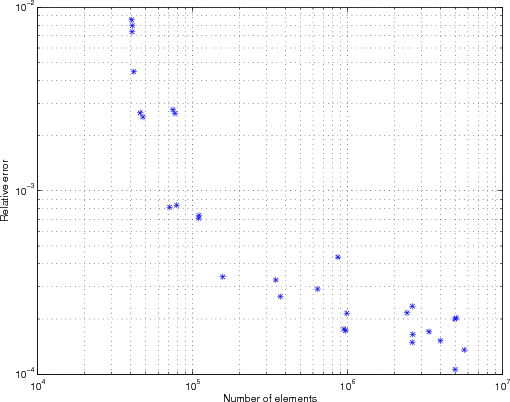
Figure: Relation between relative error and a: max element size b: number of nodes and c: number of elements. |
Last Modified: $Date: 2017-02-28 13:12:08 -0500 (Tue, 28 Feb 2017) $ by $Author: aadler $