|
|
EIDORS: Electrical Impedance Tomography and Diffuse Optical Tomography Reconstruction Software |
|
EIDORS
(mirror) Main Documentation Tutorials − Image Reconst − Data Structures − Applications − FEM Modelling − GREIT − Old tutorials − Workshop Download Contrib Data GREIT Browse Docs Browse SVN News Mailing list (archive) FAQ Developer
Hosted by |
Effects of the Meshsize parameter in NetgenSetup: use default meshsizeFirst we build a netgen model using the default meshsize, by specifying maxh=''.Call netgen:
% Call Netgen $Id: meshsize_param01.m 3266 2012-06-30 16:01:06Z aadler $
stim = mk_stim_patterns(16,1,'{ad}','{ad}',{},1);
fmdl = ng_mk_cyl_models([10,15],[16,5],[0.5]);
fmdl.stimulation= stim;
img = mk_image(fmdl,1);
vh = fwd_solve(img);

extra={'ball','solid ball = sphere(7.5,0,5;2);'};
fmdl = ng_mk_cyl_models([10,15],[16,5],[0.5],extra);
fmdl.stimulation= stim;
img = mk_image(fmdl,1);
img.elem_data(fmdl.mat_idx{2}) = 1.1;
vi = fwd_solve(img);
Reconstruct images:
% Reconstruct images $Id: meshsize_param02.m 4839 2015-03-30 07:44:50Z aadler $
imdl= mk_common_model('c2c2',16);
imdl.RtR_prior= @prior_laplace;
imdl.hyperparameter.value = 0.10;

th= linspace(0,2*pi,100); th(end)= [];
xcirc= 0.5+0.1*cos(th); ycirc= 0.1*sin(th);

subplot(121);
show_fem(img); view(0,60);

subplot(122);
show_fem(inv_solve( imdl, vh, vi(1)));
line(xcirc,ycirc,'Color',[0,0.5,0],'LineWidth',2);
axis image
ylabel(sprintf('No. Elems= %d', size(img.fwd_model.elems,1)));

print_convert meshsize_param02a.png '-density 100'
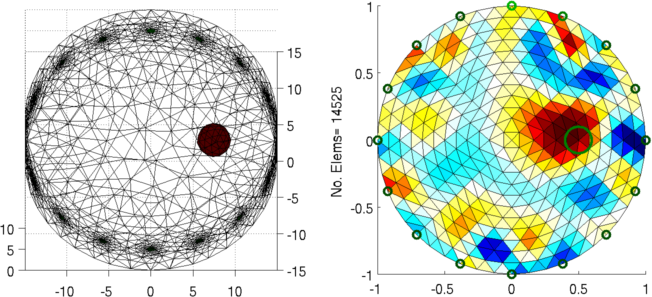
Figure: Left: forward model Right: reconstructed image (with target position in green) Calculate several meshsizes
extra={'ball','solid ball = sphere(7.5,0,5;2);'};
stim = mk_stim_patterns(16,1,'{ad}','{ad}',{},1);

for loop2 = 1:7
   switch loop2;
      case 1; maxh= 2.0;
      case 2; maxh= 1.5;
      case 3; maxh= 1.0;
      case 4; maxh= 0.8;
      case 5; maxh= 0.7;
      case 6; maxh= 0.6;
      case 7; maxh= 0.5;
   end
   fmdl = ng_mk_cyl_models([10,15,maxh],[16,5],[0.5]);
   fmdl.stimulation= stim;
   img = mk_image(fmdl,1);
   vh = fwd_solve(img);

   fmdl = ng_mk_cyl_models([10,15,maxh],[16,5],[0.5],extra);
   fmdl.stimulation= stim;
   img = mk_image(fmdl,1);
   img.elem_data(fmdl.mat_idx{2}) = 1.1;
   vi = fwd_solve(img);

   subplot(121); show_fem(img); view(0,60);

   subplot(122); show_fem(inv_solve( imdl, vh, vi(1))); axis image
   line(xcirc,ycirc,'Color',[0,0.5,0],'LineWidth',2);
   ylabel(sprintf('No. Elems= %d', size(img.fwd_model.elems,1)));

   fname= sprintf('meshsize_param03%c%c.png', 'a', loop2-1+'a');
   print_convert( fname ,'-density 100');
end
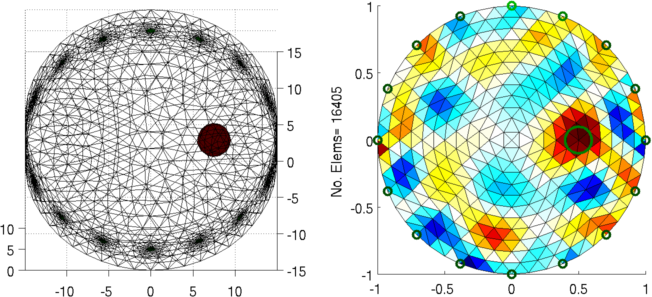 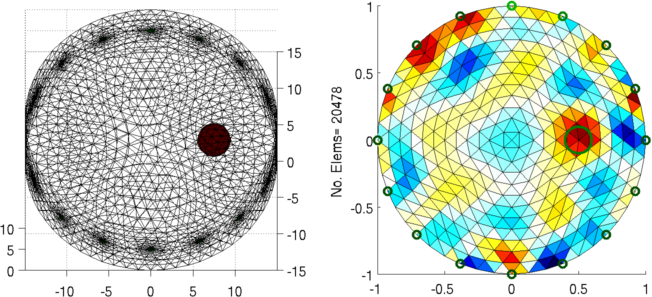 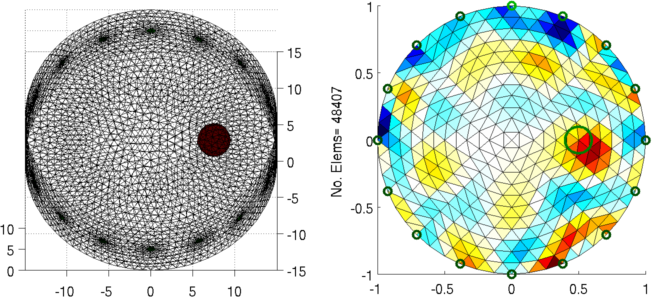 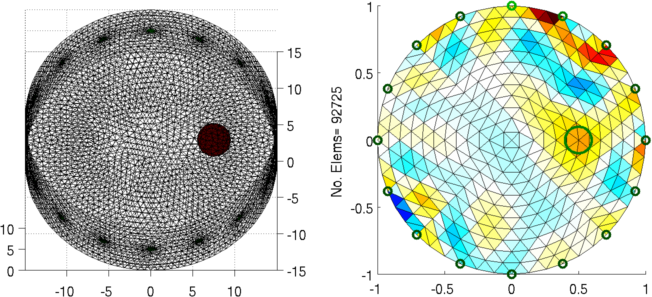 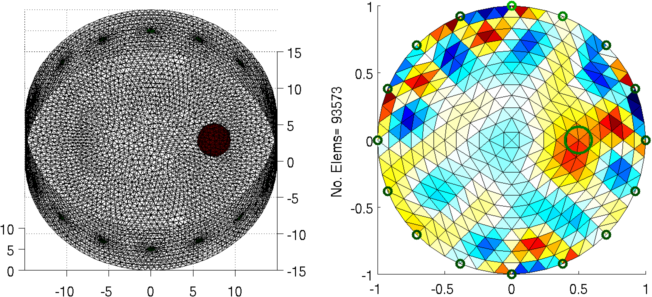 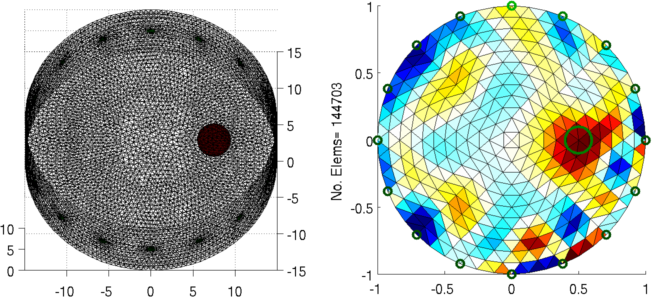 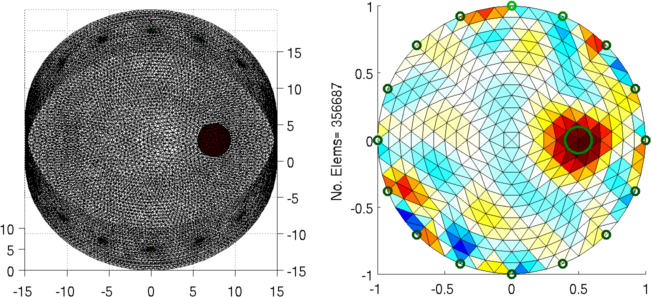 Figure: Left: forward model Right: reconstructed image (with target position in green) |
Last Modified: $Date: 2017-02-28 13:12:08 -0500 (Tue, 28 Feb 2017) $ by $Author: aadler $