|
|
EIDORS: Electrical Impedance Tomography and Diffuse Optical Tomography Reconstruction Software |
|
EIDORS
(mirror) Main Documentation Tutorials − Image Reconst − Data Structures − Applications − FEM Modelling − GREIT − Old tutorials − Workshop Download Contrib Data GREIT Browse Docs Browse SVN News Mailing list (archive) FAQ Developer
Hosted by |
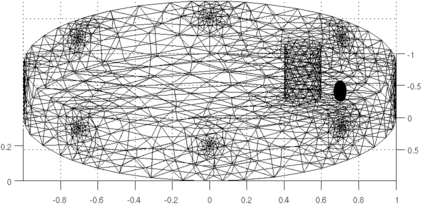
View of an electric fish in a tankWeakly electric fish use EIT to see their environment. Since they generate current (from head to tail) we can view them with other electrodes. The idea of this tutorial is to simulate a fish in tank, and then to see the world from their perspective (ie the voltage distribution on the body of the fish.Model a 3D tank with 8 electrodes and an elliptical fish
fx=0;fy=.7;fz=0.15;fl=20/75;fh=5/75;fw=5/75;
fish = sprintf('ellipsoid(%f,%f,%f;%f,0,0;0,%f,0;0,0,%f)',fx,fy,fz,fl/2,fh/2,fw/2);
shape_str = ['solid cyl = cylinder (0,0,0; 0,0,1; 1.0); \n', ...
'solid tank = orthobrick(-2,-2,0;2,2,0.3) and cyl; \n', ...
'solid obj1 = cylinder( -.3,.5,0; -.3,.5,1;0.1);\n' ...
'solid obj1t = obj1 and tank; tlo obj1t;\n' ...
'solid fish = ',fish,'; tlo fish;\n', ...
'solid mainobj= tank and not fish and not obj1 -maxh=0.3;\n'];
% Electrodes on the head and tail
elec_shape([1,2])=[0.01];
elec_pos(1,:) = [ fx-fl/2,fy,fz,-1,0,0]; elec_obj{1} = 'fish';
elec_pos(2,:) = [ fx+fl/2,fy,fz, 1,0,0]; elec_obj{2} = 'fish';
% Electrodes on the tank
n_elec = 8;
th = linspace(0,2*pi,n_elec+1)'; th(end) = [];
cs = [cos(th), sin(th)];
elec_pos = [elec_pos; cs, 0.2+0*th, cs, 0*th];
for i=2+(1:n_elec);
elec_obj{i} = 'cyl';
elec_shape(i)=[0.05];
end
fmdl = ng_mk_gen_models(shape_str, elec_pos, elec_shape, elec_obj);
show_fem(fmdl);view(90,20);
print_convert fish_tank01a.png '-density 60'
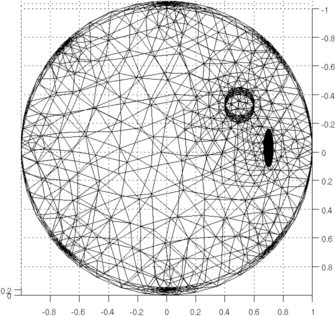
show_fem(fmdl);view(90,80);
print_convert fish_tank01b.png '-density 60'
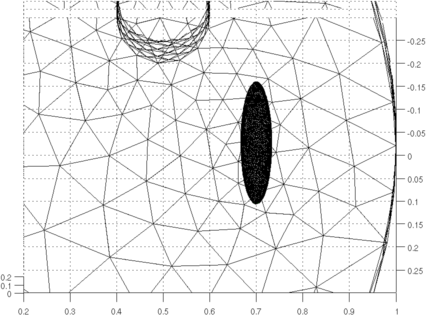
axis([-.3,.3,.2,1,0,0.2])
print_convert fish_tank01c.png '-density 60'
Create stim_patterns and meas_patterns for the fish
% Set stimulation (elecs 1,2 are the fish)
fmdl.stimulation(1).stim_pattern = [1;-1;zeros(n_elec,1)];
fmdl.stimulation(1).meas_pattern = sparse([ ...
    0, 0, 1, 0, 0, 0,-1, 0, 0, 0;
    0, 0, 0, 1, 0, 0, 0,-1, 0, 0;
    0, 0, 0, 0, 1, 0, 0, 0,-1, 0;
    0, 0, 0, 0, 0, 1, 0, 0, 0,-1]);

img = mk_image( fmdl, 1);
img.elem_data( fmdl.mat_idx{1} ) = 1.1;  % fish is conductive
img.elem_data( fmdl.mat_idx{3} ) = 0.001;% target is non-conductive
Solve for the voltage distribution in the tankimg.fwd_solve.get_all_meas = 1; vv = fwd_solve(img); img_v = rmfield(img, 'elem_data'); img_v.node_data = vv.volt(:,1); img_v.calc_colours.npoints = 128; show_slices(img_v,[inf,inf,fz/2]); print_convert fish_tank03a.png '-density 60' % slice in y between fish and target show_slices(img_v,[inf, mean([fy,0.5]),inf]); print_convert fish_tank03b.png '-density 60' 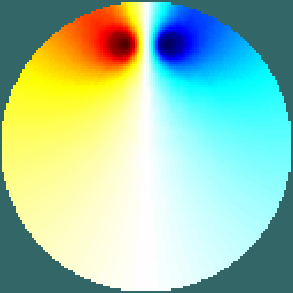
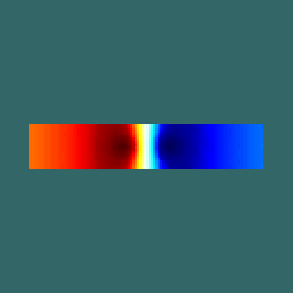
Solve for the voltage distribution near the fish's head% zoom in on the voltage in a cut plane on the face img_v = rmfield(img, 'elem_data'); img_v.node_data = vv.volt(:,1); img_v.calc_colours.npoints = 1000; show_slices(img_v,[fl/2-0.1,inf,inf]); axis([700,1000,400,600]) print_convert fish_tank04a.png '-density 60' 
|
Last Modified: $Date: 2017-02-28 13:12:08 -0500 (Tue, 28 Feb 2017) $ by $Author: aadler $