EIDORS
(mirror)
Main
Documentation
Tutorials
− Image Reconst
− Data Structures
− Applications
− FEM Modelling
− GREIT
− Old tutorials
− Workshop
Download
Contrib Data
GREIT
Browse Docs
Browse SVN
News
Mailing list
(archive)
FAQ
Developer
Hosted by

| |
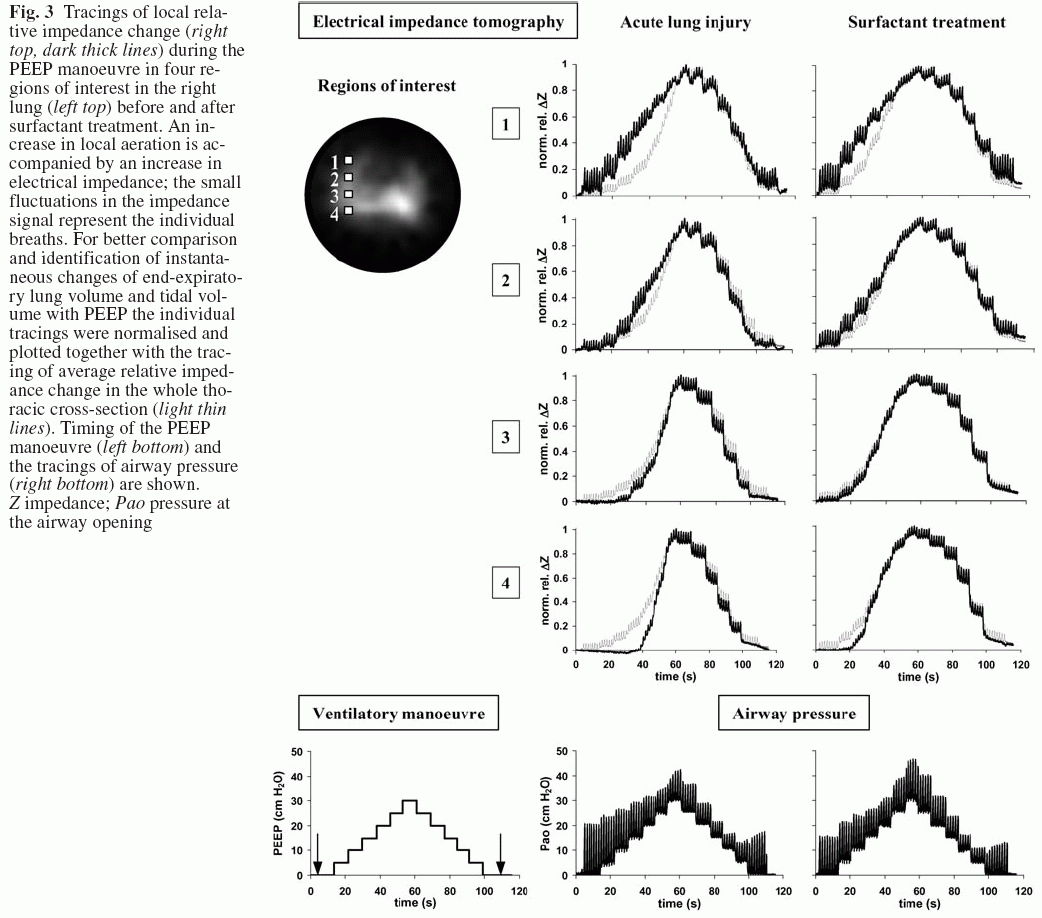
PEEP trial after lung injury (pig)
Methods and Data
The measurements were performed in the same pig after induction of
acute lung injury by repeated bronchoalveolar lavage (p1130107.get) and
after administration of surfactant (p1130122.get). Both measurements
were acquired at a rate of 13 scans/s, a total of 1500 frames were
obtained. The excitation current was 50 kHz. The data was acquired
during an incremental and decremental PEEP trial (stepwise increase and
decrease of positive end-expiratory pressure).
Data were published in
Frerichs, I., Dargavillle, P.A., Dudykevych, T., Rimensberger,
P.M. (2003)
Electrical Impedance Tomography − a method for monitoring
regional lung aeration and tidal volume distribution?
Intensive Care Med. 29:2312-2316, 2003.
Results
The key results are shown in Fig.3 from the paper
EIDORS Analysis
- Download the
data and save it to your working directory.
- Create a FEM model of the pig
% Create Model $Id: if_peep_trial01.m 3371 2012-07-02 09:08:43Z bgrychtol $

fmdl = mk_library_model('pig_23kg_16el');
[fmdl.stimulation fmdl.meas_select] = mk_stim_patterns(16,1,'{ad}','{ad}');
fmdl = mdl_normalize(fmdl, 1);  % Use normalized difference imaging
opt.noise_figure = 0.5; opt.imgsz = [64 64];
imdl = mk_GREIT_model(fmdl, 0.25, [], opt);

% subplot(211);
show_fem(imdl.fwd_model, [0,1,0]);
axis equal; axis off

hh=text(-1.1,0,'Right');
set(hh,'Rotation',90,'HorizontalAlignment','Center');
hh=text(0,-1.15,'Ventral');
set(hh,'HorizontalAlignment','Center');

print_convert if_peep_trial01.png
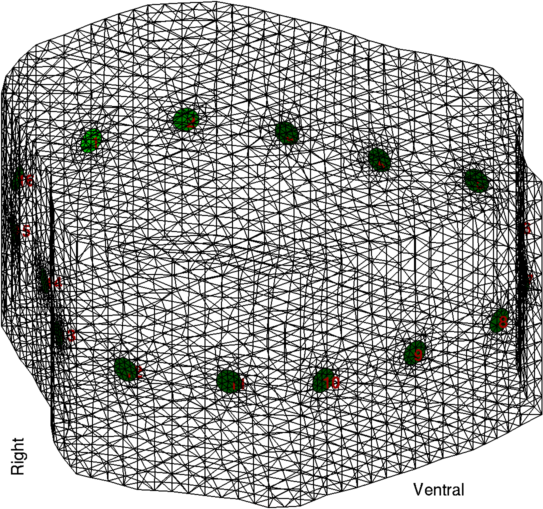
Figure:
3D FEM of pig thorax
- Reconstruct images
% Reconstruct Images $Id: if_peep_trial02.m 1535 2008-07-26 15:36:27Z aadler $

v_injury = eidors_readdata('p1130107.get');
r_injury = mean(v_injury(:,1:10),2); % reference meas
v_treat  = eidors_readdata('p1130122.get');
r_treat  = mean(v_treat(:,1:10),2); % reference meas

i_injury = inv_solve(imdl, r_injury, v_injury);
i_treat  = inv_solve(imdl, r_treat , v_treat );
- Select Regions of interest to plot
% Select ROI's

img = i_injury; img.elem_data = img.elem_data(:,700);
rimg = calc_colours( calc_slices( img ), img);

np= calc_colours('npoints');
xlocn= 5/16 * np;
ylocn= [4:2:10]/16 * np;
for yl = 1:4;
   rimg(ylocn(yl) + (-2:2), xlocn + (-2:2) ) = 1;
end
image(rimg); axis square

for yl = 1:4;
   text(xlocn-1, ylocn(yl), num2str(yl));
end

axis off
print_convert if_peep_trial03.png
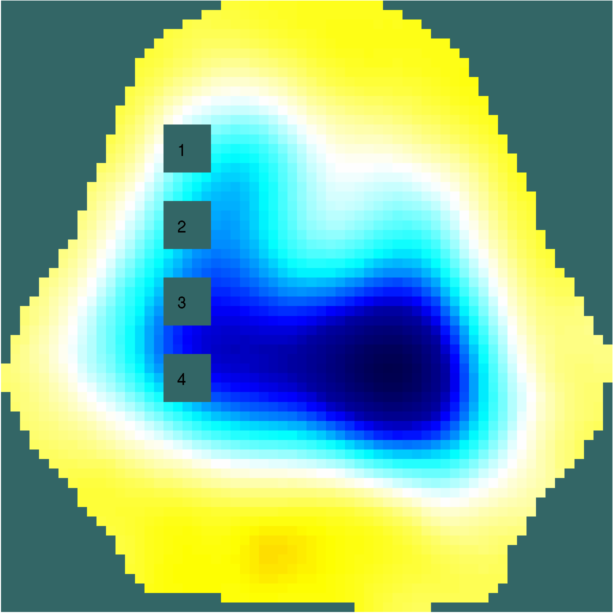
Figure:
Image of ventilation and 4 identified points to analyse
regional ventilation
- Normalized Impedance Change (ΔZ) at each ROI
% Display Times courses $Id: if_peep_trial04.m 5788 2018-05-21 22:35:48Z aadler $

for loop = 1:2;
   if loop == 1; img = i_injury;
   else          img = i_treat;
   end

   subplot(2,2,loop);
   time = (0:size(img.elem_data,2)-1)/13; % Frame rate = 13/s

   raster= calc_slices( img );
   ROIs  = raster(ylocn, xlocn, :);
   ROIs  = permute(ROIs, [3,1,2]);

   %Normalize to its maximum
   for i=1:length(ylocn)
      ROIs(:,i) = - ROIs(:,i) / max(abs(ROIs(:,i)));
   end
   plot(time, ROIs);
   axis([0, max(time), -0.1, 1]);
   legend('1','2','3','4','Location','NorthWest')
   xlabel('time (s)')
   ylabel('normalized \Delta Z')
end

print_convert if_peep_trial04.png '-density 175'
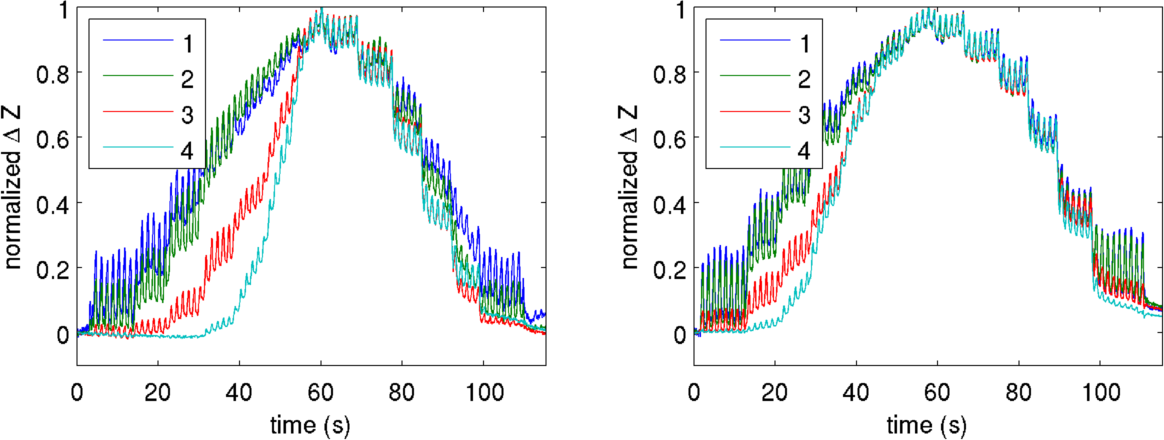
Figure:
Normalized ΔZ time course for different lung ROIs.
Left Lung Injury
Right Treated
- Animate Output for each condition
This function creates a video of the sample sequences.
% Show images $Id: if_peep_trial05.m 1535 2008-07-26 15:36:27Z aadler $

for loop = 1:2;
   if loop == 1; img = i_injury; fn= 'a';
   else          img = i_treat;  fn= 'b';
   end

   % image properties
   img.calc_colours.npoints     = 32;
   img.calc_colours.window_range= .5;
   img.calc_colours.ref_level   = 0;
   img.calc_colours.greylev     = 0.01;
   img.calc_colours.backgnd     = [1,1,1];
   img.animate_reconstructions.show_times = 1;

   animate_reconstructions(['if_peep_trial05',fn], img);
end


Figure:
Video of sample sequences
Left Lung Injury
Right Treated
|