|
|
EIDORS: Electrical Impedance Tomography and Diffuse Optical Tomography Reconstruction Software |
|
EIDORS
(mirror) Main Documentation Tutorials − Image Reconst − Data Structures − Applications − FEM Modelling − GREIT − Old tutorials − Workshop Download Contrib Data GREIT Browse Docs Browse SVN News Mailing list (archive) FAQ Developer
Hosted by |
EIDORS data structures and VariablesWhat version am I running?
>> eidors_obj('eidors_version')
ans =
3.2
Controlling Output ImagesThe colours of the graphics may be controlled with the calc_colours function. This applies to output of the show_fem and show_slices and other functions that work using the matlab graphics engine.
% Show EIDORS colours $Id: eidors_vars01.m 3273 2012-06-30 18:00:35Z aadler $

imdl= mk_common_model('a2c2',16);
img= mk_image(imdl.fwd_model,0);
img.elem_data(1:2)=[1,1];
img.elem_data([14,16])=[-1,-1];
img.elem_data([27,30])=.5*[1,1];
show_fem(img);

print_convert  eidors_vars01a.png '-density 50'
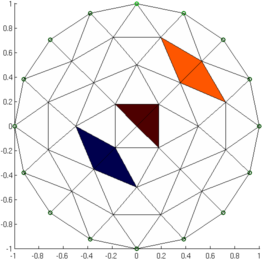
Figure: Simple EIDORS image with three contrasts to show the effect of changing the colour mapping parameters The Calc Colours function can modify these values:
calc_colours( 'param', value );
Image Output Resolution
% Show EIDORS colours $Id: eidors_vars02.m 2757 2011-07-14 15:56:06Z bgrychtol $

subplot(131)
calc_colours('npoints',32);
show_slices(img);

subplot(132)
calc_colours('npoints',128);
show_slices(img);

subplot(133)
calc_colours('npoints',64);
show_slices(img); %default value
print_convert eidors_vars02a.png '-density 100'

Figure: Effect of changing the npoints parameter. From left: 1) npoints=32 2) npoints=128 3) npoints=64 (default) Image Reference Colours
% Show EIDORS colours $Id: eidors_vars03.m 2757 2011-07-14 15:56:06Z bgrychtol $

clf;
% Set square figure and make figure fill the axis
axes('position',[0 0 1 1]);
pp= get(gcf,'paperposition');
set(gcf,'paperposition',[pp(1:3),pp(3)]);

calc_colours('greylev',.001); % black background level
show_slices(img);
print_convert eidors_vars03a.png '-density 20'

calc_colours('greylev',.2); % grey background level
show_slices(img);
print_convert eidors_vars03b.png '-density 20'

calc_colours('greylev',-.2); %light grey background level
show_slices(img);
print_convert eidors_vars03c.png '-density 20'

calc_colours('greylev',-.001); %white background level (default)
show_slices(img);
print_convert eidors_vars03d.png '-density 20'


calc_colours('backgnd',[0.2,0.1,0.15]);
show_slices(img);
calc_colours('backgnd',[0.5,0.5,0.15]); %default value
print_convert eidors_vars03e.png '-density 20'
set(gcf,'paperposition',pp(1:4));


Figure: Effect of changing the greylev parameter. From left: 1) greylev=0.001 2) greylev=0.2 3) greylev=-0.2 4) greylev=-0.001 (default) 5) Changing backgnd Colour Mapping in the imageThe default EIDORS behaviour is to auto range the colours, so that the full image range is displayed. This can be changed to set a strict colour limit, or to show a non linear colour break.
% Show EIDORS colours $Id: eidors_vars04.m 2757 2011-07-14 15:56:06Z bgrychtol $

idx= [51:52, 56:-1:53, 57:60, 64:-1:61, 49,50]; % clockwise index elements
img.elem_data(idx)= linspace(-2,2,16);
subplot(131)
calc_colours('clim',1.3); % Limit colours to 1,3
show_slices(img);

subplot(132)
calc_colours('clim',[]); % default
show_slices(img);

subplot(133)
img.calc_colours.clim= .3;
show_slices(img);
print_convert eidors_vars04a.png '-density 100'

Figure: Effect of changing the greylev parameter. From left: 1) clim=1.3 2) clim=[] (autorange) 3) clim=0.3 |
Last Modified: $Date: 2017-02-28 13:12:08 -0500 (Tue, 28 Feb 2017) $ by $Author: aadler $