
|
EIDORS: Electrical Impedance Tomography and Diffuse Optical Tomography Reconstruction Software |
|
EIDORS
(mirror) Main Documentation Tutorials − Image Reconst − Data Structures − Applications − FEM Modelling − GREIT − Old tutorials − Workshop Download Contrib Data GREIT Browse Docs Browse SVN News Mailing list (archive) FAQ Developer
|
Simulation of voltages over time due to transient current inputsEIDORS uses frequency-domain forward modelling (i.e. the model is solved for stimulus at a given frequency f=2πω). To use EIDORS to make time-domain simulations, we need to use Fourier synthesis.
%Create 2D model
ball1 = 'solid ball = cylinder(0.1,0.4,0;0.1,0.4,1;0.3) and orthobrick(-1,-1,0;1,1,0.05) -maxh=0.1;';
box1  = 'solid box = orthobrick(-0.6,-0.6,0; 0.1,-0.1,0.05) -maxh=0.1;';
fmdl= ng_mk_cyl_models(0,[8],[0.2,0,0.05],{'ball','box',[ball1,box1]});
fmdl.stimulation = stim_meas_list([1,5,2,3],8,.01,1);
inclusion = vertcat( fmdl.mat_idx{2:3} );
%Conductivity and permittivity parameters
img = mk_image( fmdl, 1);

img.elem_data(inclusion) = .01;
img.fwd_solve.get_all_meas=1; %Get all measurements

subplot(221); show_fem(img);
print_convert transients01a.png

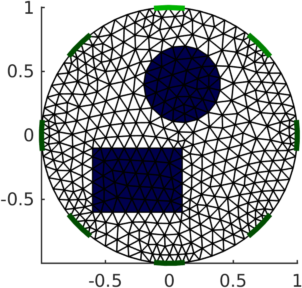
Figure: Regions of coductivity and permittivity in circular 2D model img.calc_colours.component = 'real'; % display real component of current for i=1:2 if i==1; cplx= .01; else ; cplx= .01 - pi*2i *100; end img.elem_data( inclusion ) = cplx; subplot(2,2,i); show_current(img); axis off end print_convert transients02a.png red = real(img.elem_data); % in-phase ied = (imag(img.elem_data)~=0)*.01; % out-of-phase 
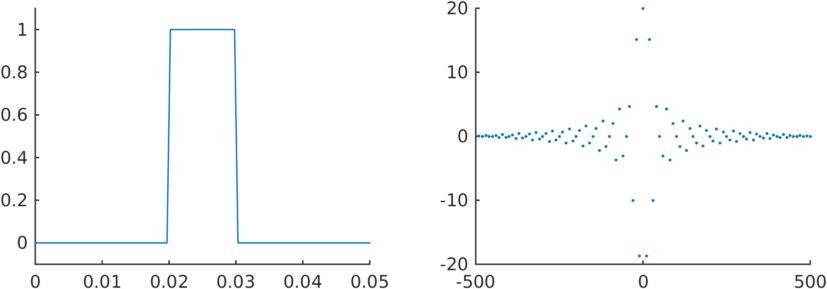
Figure: Patterns of current flow at (left) f=0 and (right) f=100. tlim = 0.05; tpts = 100; fmax = 1/tlim*(tpts/2); tax = linspace(0,tlim,tpts); puls= tax> 0.4*tlim & tax<0.6*tlim; fpul = fftshift(fft(puls)); fax = linspace(0,fmax,tpts+1); fax(end)=[]; fax = fftshift(fax); fax(fax>0.5*fmax) = fax(fax>0.5*fmax) - fmax; subplot(221); plot(tax, puls); ylim([-.1,1.1]); box off; subplot(222); plot(fax, real(fpul),'.'); box off; clear vn; for i=fliplr(1:tpts) img.elem_data= red + ied*fax(i)*2j*pi; vv = fwd_solve(img); vn(:,i) = fpul(i)*vv.volt; end print_convert transients03a.png 
Figure: Left: Pulsatile current input vs time (s). Right: Fourier series of input waveform.
% Inverse Transform
vt = ifft(ifftshift(vn,2),[],2);
if norm(real(vt(:))) < 1e-10*norm(imag(vt(:))); error('ifft'); end

subplot(211);

imgn = rmfield(img,'elem_data');
imgn.node_data = real(vt);
imgn.show_slices.img_cols = 10;
imgn.get_img_data.frame_select = round(0.3*tpts):round(0.79*tpts);
show_slices( imgn);

print_convert transients04a.png

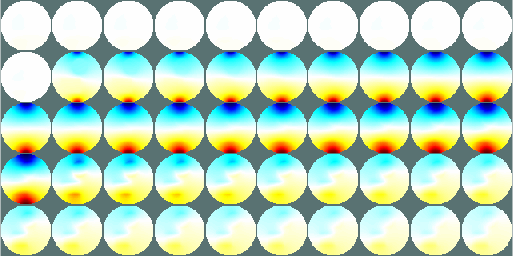
Figure: Images of voltage as a function of time rimg = calc_slices(imgn); slice = rimg(:,32,:); image(calc_colours(reshape(slice,64,[]), imgn)) print_convert transients05a.png 
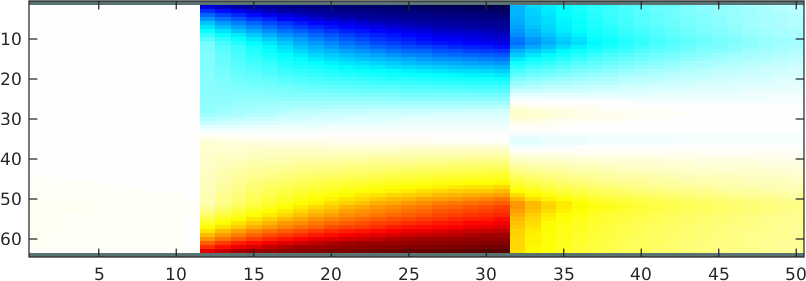
Figure: Slice through the image centre as a function of time |
Last Modified: $Date: 2017-04-28 13:02:29 -0400 (Fri, 28 Apr 2017) $ by $Author: aadler $