|
|
EIDORS: Electrical Impedance Tomography and Diffuse Optical Tomography Reconstruction Software |
|
EIDORS
(mirror) Main Documentation Tutorials − Image Reconst − Data Structures − Applications − FEM Modelling − GREIT − Old tutorials − Workshop Download Contrib Data GREIT Browse Docs Browse SVN News Mailing list (archive) FAQ Developer
Hosted by |
Correction for effect of serial data collectionMost EIT systems use serial data collection which, if uncorrected, results in image distortion, particularly when breathing rates are high compared to the acquisition frame rate. This tutorial demonstrates use of the correction tool documented in the published papers
The original versions of this software and a compiled tool (for windows only) are available ExampleDownload example data set (ventilated neonate) and unzip to a known location.Correct using GUIframe_timing_correct_gui % Navigate to location of data % Choose file nm18.get % New file is saved as [ORIGINALNAME].get = nm18-corrected.get % print_convert frame_timing_correct01a.jpgOutputs: *_corrected.get & associated *_corrected.prl files (if the original *.prl file is in the same directory). These can now be reconstructed with using your normal method. The absolute percentage difference between original and corrected data as mean (+/- std) of all electrode combinations is displayed in a pop up box. In addition, the function checks for reciprocity errors. Reciprocity is a measure of the quality and reliability of the data, including the improvement in quality due to lag correction (see Reciprocity theory box, below). If any electrode combination has a median reciprocity error greater than a predetermined threshold a message box pops up, stating the percentage of electrode combinations affected, and optionally provides a graphical representation of the reciprocity errors (click display). The threshold is currently set at the arbitrary value of 5%, based in experience that human data with errors less than this, on most electrode combinations, can usually be obtained. The upper plot, of the graphical representation, is reciprocity errors as a function of time and would show, for example, an electrode developing a permanent or temporary fault during the experiment, and when this occurred. The lower plot shows the mean (+/- std) for each electrode combination. Electrode combinations using the same drive pair are grouped together, and the x-axis is labelled to reflect this. The number of electrodes exceeding the threshold will always be zero or an even number, since each electrode combination has a reciprocal pair, and it is not know which of them is most accurate. 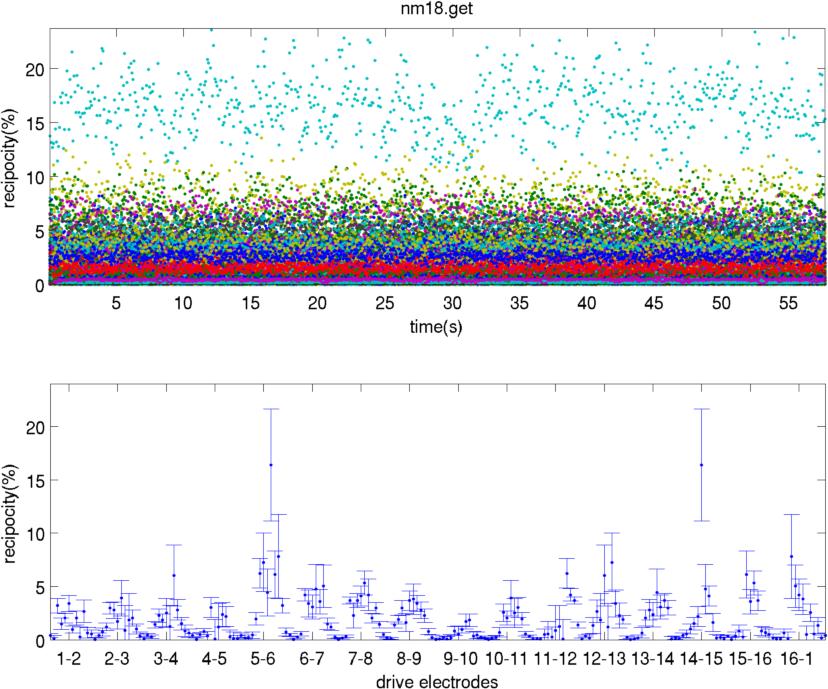
Figure: In this example, all reciprocities are stable over time, with one pair of combinations at ~40% error and a few around 25%. Create inverse model of neonate using FEM model from EIDORS library
fmdl = mk_library_model('neonate_16el_lungs');
[fmdl.stimulation fmdl.meas_select] = mk_stim_patterns(16,1,'{ad}','{ad}',{'rotate_meas'});
fmdl = mdl_normalize(fmdl, 1);  % Use normalized difference imaging
opt.noise_figure = 0.2; opt.target_size = 0.1;
opt.square_pixels = 1; opt.distr = 3;

inv_mdl = mk_GREIT_model(fmdl, 0.25,5, opt);
Load original and corrected data, and reconstruct images of last breath, using the average of all frames as the reference.
Original = eidors_readdata('nm18.get','GET-RAW');
Orig_ref = mean(Original,2); % reference frame - average of all frames
Orig_imag=inv_solve(inv_mdl,Original(:,691:717),Orig_ref); %reconstruct difference images

%Corrected = eidors_readdata('nm18_corrected.get','GET-RAW');  % If using GUI
Corrected = frame_timing_correct( Original, 'FFT');
Corr_ref = mean(Corrected,2); % reference frame - average of all frames
Corr_imag=inv_solve(inv_mdl,Corrected(:,691:717),Corr_ref); %reconstruct difference images
Display images from last breathsubplot(121); show_slices(Orig_imag); title 'Original' subplot(122); show_slices(Corr_imag); title 'Corrected' print_convert frame_timing_correct03a.jpg 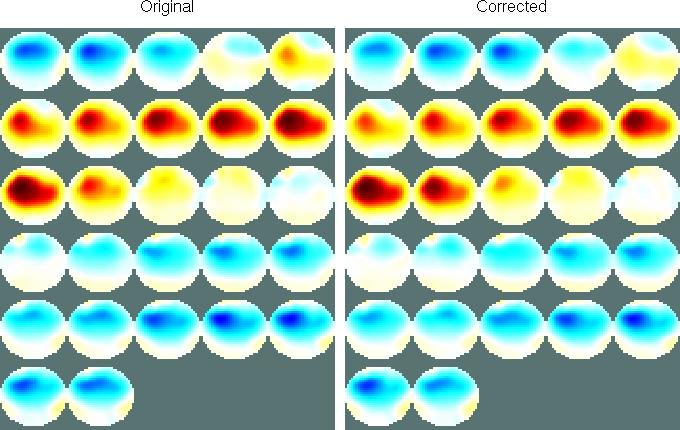
Figure: The first image is the top left, continuing in normal reading order to the bottom row, right hand image. Red indicates relative impedance increases (inspiration) and blue relative impedance decreases (expiration). Changes in the upper left of each image occur sooner in the original than the corrected series, and the left and right sides appear more unbalanced in the original series. If a different reconstruction algorithm is used the images will be slightly different, but similar trends should be expected. Note on reciprocity:EIT images are reconstructed from sets of 4-electrode impedance measurements i.e. current is injected via one pair of electrodes (j,k) and measured with a separate pair (m,n). Theoretically the same result would be obtained if the electrodes were reversed – i.e. injection m,n, measurement j,k. However this is not so in in practice due to non-idealities in the system and electrode/skin interface. The absolute difference between the two measurements is termed the reciprocity error and is normally expressed as a percentage relative to the mean of the two measurements. Many EIT systems collect from all electrode combinations, enabling reciprocity to checked after data collection. |
Last Modified: $Date: 2017-05-24 09:41:35 -0400 (Wed, 24 May 2017) $ by $Author: aadler $