|
|
EIDORS: Electrical Impedance Tomography and Diffuse Optical Tomography Reconstruction Software |
|
EIDORS
(mirror) Main Documentation Tutorials − Image Reconst − Data Structures − Applications − FEM Modelling − GREIT − Old tutorials − Workshop Download Contrib Data GREIT Browse Docs Browse SVN News Mailing list (archive) FAQ Developer
Hosted by |
GREIT Reconstruction for an neonate human thorax geometryDataData are available Here. Data were recorded from a 10-day old spontaneously breathing neonate lying in the prone position with the head turned to the left, as documented in: S. Heinrich, H. Schiffmann, A. Frerichs, A. Klockgether-Radke, I. Frerichs, Body and head position effects on regional lung ventilation in infants: an electrical impedance tomography study. Intensive Care Med., 32:1392-1398, 2006.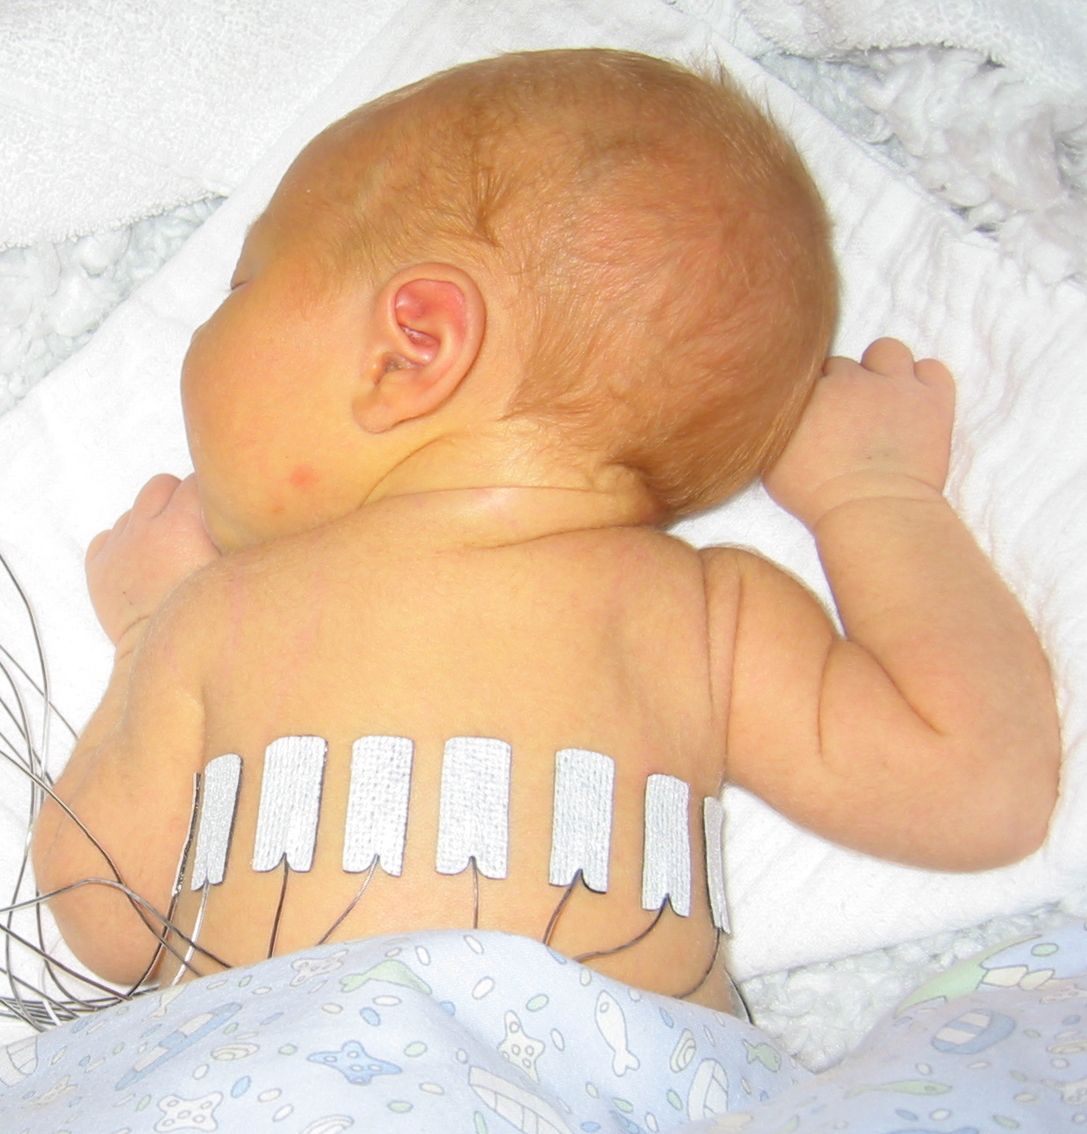
Image reconstruction modelForward model model
% Inverse model
%fmdl = mk_library_model('neonate_16el_lungs');
elec_pos = [16,1,.5]; elec_shape=[0.15,0.3,0.01,0,60]; maxsz=0.08; nfft=27;
fmdl = mk_library_model({'neonate','boundary','left_lung','right_lung'}, ...
      elec_pos, elec_shape, maxsz,nfft);

[fmdl.stimulation fmdl.meas_select] = mk_stim_patterns(16,1,'{ad}','{ad}');
fmdl = mdl_normalize(fmdl,1);

img = mk_image(fmdl,1); img.elem_data(vertcat(fmdl.mat_idx{2:3})) = 0.3;
img.calc_colours.ref_level=1;

calc_colours('defaults');
show_fem_enhanced(img); view(-2,32)
print_convert neonate_ex01a.jpg
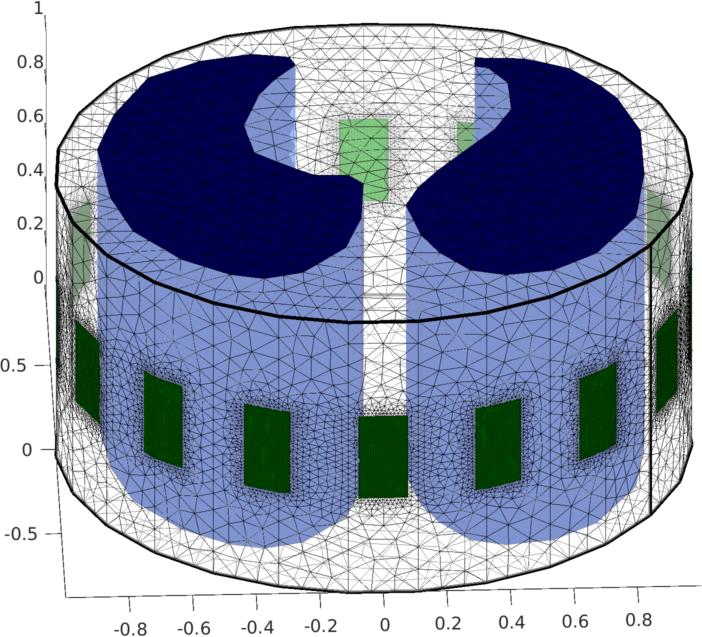
Figure: Finite element model of thorax
img = mk_image(fmdl,1); img.elem_data(vertcat(fmdl.mat_idx{2:3})) = 0.6;
opt.square_pixels = 1; opt.imgsz = [64 64];
%opt.noise_figure = 0.5;
%imdl = mk_GREIT_model(img, 0.20, [], opt);
imdl = mk_GREIT_model(img, 0.20, 10, opt);
GREIT reconstructionReconstruct images
% Data: eidors3d.sf.net/data_contrib/if-neonate-spontaneous/if-neonate-spontaneous.zip
vv= eidors_readdata('P04P-1016.get');

% solve with reference to the mean
imgall = inv_solve(imdl,mean(vv,2),vv);
[insp, expi] = find_frc(imgall,[],13,[],2); % find breaths

% use expirations as reference
imgr = inv_solve(imdl,vv(:,expi),vv(:,insp(2:end)));
   imgr.calc_colours.ref_level= 0;
   imgr.calc_colours.backgnd= [1 1 1];
   imgr.calc_colours.greylev= 0.001;
   imgr.show_slices.img_cols = 4;
   imgr.show_slices.sep      = 2;
show_slices(imgr);

print_convert neonate_ex03a.png
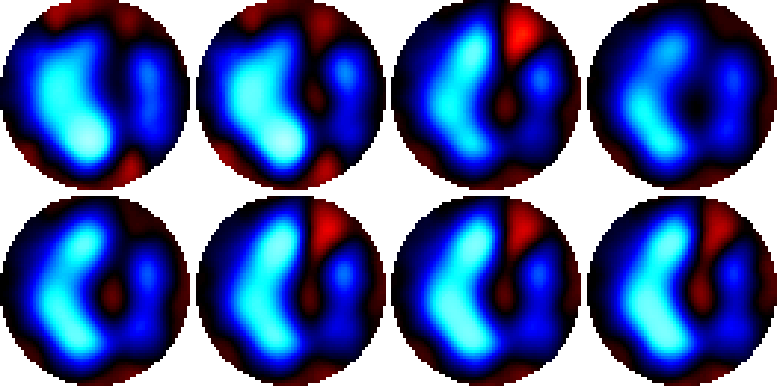
Figure: Images of three different breaths (end inspiration)
%%BUG. NEED TO FIND IMGALL.

% positions of where to plot
yposns = [20 20 45 45];
xposns = [20 45 20 45];

% Show image
clf; axes('position',[0.05,0.5,0.25,0.45]);
img1= imgall; img1.elem_data = imgall.elem_data(:,45);
show_slices(img1);
hold all;
for i = 1:4
    plot(xposns(i),yposns(i),'s','LineWidth',5);
end
hold off;

% Show plots
imgs = calc_slices(imgall);
axes('position',[0.32,0.6,0.63,0.28]);

imgs = permute(imgs,[3,1,2]);
taxis =  (0:size(imgs,1)-1)/13; % frame rate = 13
hold all
for i = 1:4
    plot(taxis,imgs(:,yposns(i),xposns(i)),'LineWidth',2);
end
hold off
set(gca,'ytick',[]);
xlim([0 16]);

print_convert neonate_ex03a.png
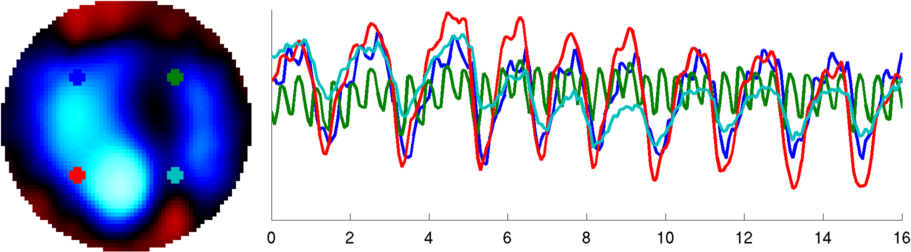
Figure: (bottom) time course of several lung pixels Use Elliptic GREIT modelThe shape of a neonate is roughly elliptical. Based on the neonate CT here, the elliptical ration is about 1:1.14.
clf
n_elecs = 16;

% Elliptic model
[fmdle,midx] = ng_mk_ellip_models([1, 1.14,1,0.15] ,[n_elecs,0.5],[0.05]);
[stim,msel] =  mk_stim_patterns(n_elecs,1,[0,1],[0,1],{'no_meas_current'}, 1);
fmdle.stimulation =  stim;
fmdle.meas_select =  msel;
fmdle = mdl_normalize(fmdle, 1);

% GREIT Ellip - circ objects
opt.distr = 0; % central
opt.noise_figure = 0.5;
imdl = mk_GREIT_model(mk_image(fmdle,1), 0.25, [], opt);

vh = mean(vv,2);        % reference is average
vi = vv(:,[45,70,173]); %3 inspirations

img = inv_solve(imdl,vh,vi);

img.show_slices.img_cols = 3;
img.show_slices.sep      = 2;
img.calc_colours.ref_level=0;
show_slices(img);

print_convert neonate_ex04a.png
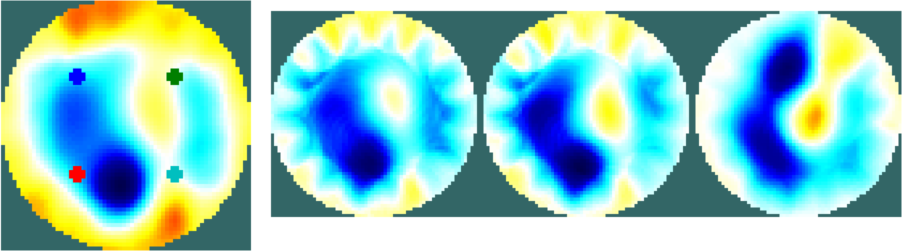
Figure: Images of lungs using ellipcal GREIT reconstruction |
Last Modified: $Date: 2017-02-28 13:12:08 -0500 (Tue, 28 Feb 2017) $ by $Author: aadler $