|
|
EIDORS: Electrical Impedance Tomography and Diffuse Optical Tomography Reconstruction Software |
|
EIDORS
(mirror) Main Documentation Tutorials − Image Reconst − Data Structures − Applications − FEM Modelling − GREIT − Old tutorials − Workshop Download Contrib Data GREIT Browse Docs Browse SVN News Mailing list (archive) FAQ Developer
Hosted by |
Sensitivity of EIT and ReconstructionSensitivity of EIT in 2DThe regional sensitivity of EIT for a particular current pattern can be shown
% Sensitivity map $Id: sensitivity_map01.m 4070 2013-05-26 21:22:03Z bgrychtol $

imdl= mk_common_model('f2d1c',16); % 'j2d1c'
J= calc_jacobian(calc_jacobian_bkgnd(imdl));
Sens = J(5,:)'./get_elem_volume(imdl.fwd_model);
img = mk_image(imdl, Sens);

img.calc_colours.npoints= 256;
img.calc_slices.filter = conv2(ones(3),ones(3));
img.calc_colours.clim = 0.5;
show_slices(img);
print_convert('sensitivity_map01a.png','-density 60');

img.calc_colours.cb_shrink_move = [0.5,0.7,0];
clf;axis square,show_fem(img,[1,1]);axis off
print_convert('sensitivity_map01b.png','-density 60');
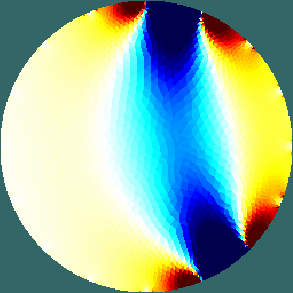
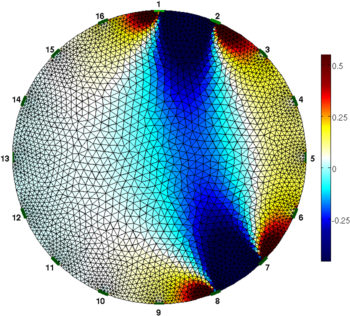
Figure: Sensitivity field of 2D EIT to a single simulation ([1-2]) and measurement [7-8] pattern Reconstruction from each component
% Sensitivity map $Id: sensitivity_map02.m 3561 2012-08-01 12:04:39Z bgrychtol $

fwd_model= ng_mk_cyl_models([2,1,.07],[16,1.0],[0.1]);
fwd_model.stimulation = mk_stim_patterns(16,1,[0,1],[0,1],{},1);
J= calc_jacobian( mk_image(fwd_model,1) );
Sens = J(5,:)'./get_elem_volume(fwd_model);
img = mk_image(fwd_model, Sens');

img.calc_colours.clim= 3e-2;

img.calc_colours.npoints= 256;
% img.calc_slices.filter = conv2(ones(3),ones(3));
img.calc_colours.transparency_thresh = -1;
show_3d_slices(img,[0.7,1.0],[0.5],[]);
view(-70,22);
print_convert('sensitivity_map02a.png','-density 60');
view(-70,62);
print_convert('sensitivity_map02b.png','-density 60');

np = interp_mesh(img.fwd_model);
img.calc_colours.transparency_thresh = .15;
img.elem_data(np(:,3)>1.05)= 0;
show_fem(img);

% Show better
view(-70,52);
crop_model(gca, inline('-x/5 + z>1.05','x','y','z'))
print_convert('sensitivity_map02c.png','-density 60');
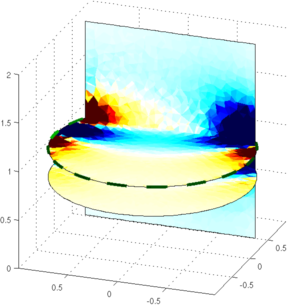
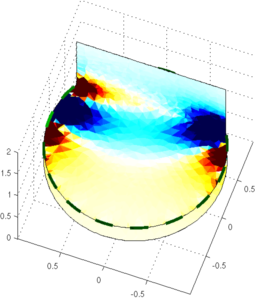
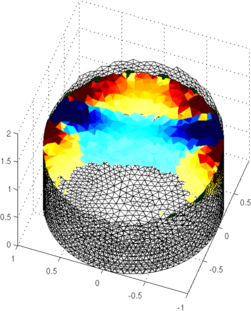
Figure: Sensitivity field of 3D EIT to a single simulation ([1-2]) and measurement [7-8] pattern |
Last Modified: $Date: 2017-02-28 13:12:08 -0500 (Tue, 28 Feb 2017) $ by $Author: aadler $