
|
|
Carleton
|
BIOM5200 - Midterm Exam Winter 2007You have 80 miutes to complete this exam. The exam has four questions; you are required to answer any two of them. Each question is worth equal marks. This is a closed book exam; however, you are permitted to bring one (1) 8.5"×11" sheet of notes into the exam. You are permitted to use a non-programmable calculator. You may not communicate with anyone during the exam except the instructor.You may use the following conditions and equations for your calculations:
1. X-ray Detectors1A. Sketch a diagram of a semiconductor detector for X-rays. Show the connection for signals, the P/N doped material and the depletion layer. Indicate the path of an example detected X-ray, and explain briefly how a signal in the detector is generated. 1B. Choose one other X-ray detector type (your choice). i) Briefly describe the detector and how it functions. ii) Discuss one advantage and one disadvantage of the semiconductor detector in comparison to the other detector type. 1C. Silicon has a mass attenuation coefficient of 4.2 cm²/g at 20 keV. The density of silicon is 2.3 g/cm³. Given a semiconductor detector with a depletion layer width of 100µm and 500µm of Silicon material above the depletion layer (ignore any other material above the silicon). All X-ray photons captured in the depletion layer are detected as signal (and no others are). Calculate the detector efficiency (fraction of X-ray photons captured as signal vs total photons) at 20 keV. 2. Fourier Transform CR Image reconstruction2A. Brief describe (using sketches as necessary) the process of Fourier transform image reconstruction in Computed Tomography, 2B. Continuing your description from the previous section, explain why Fourier transform image reconstruction shows more noise at higher resolutions 2C. In the Fourier Transporm image, each radon projection p(t,θ) gives data for the low frequency 2D Fourier transform point F(0,0). What does the data point F(0,0) represent, and why is its value provided by all radon projection data? Two equivalent expressions for the Radon transform, and the equation for the Fourier transform are given: p(t,θ) = ∫ f( tcosθ−ssinθ, tsinθ−scosθ ) ds F(ω) = (1/√2π) ∫ f(t) exp( −jωt ) dt 3. PET Imaging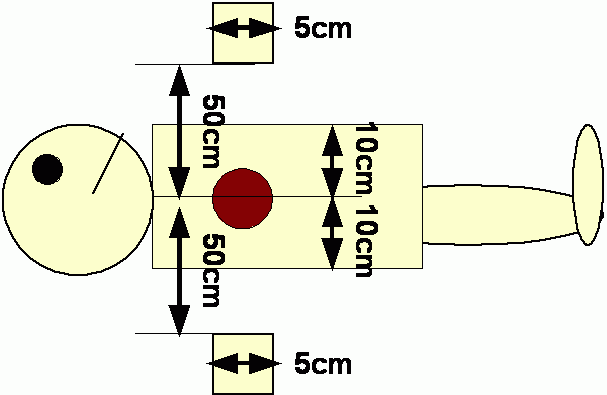
Figure: A PET imaging scenario. The heart is at the centre of the body, and is 50 cm from the detectors and 10 cm from the body surface. Detectors are 5 cm wide. 3A. A Positron Emission Tomography system is used as shown in the figure, in order to image the heart. Radioisotope is in the heart (which can be considered to be very small, ie. like a point source). Sketch emitted X-rays that are: 1) detected by PET, 2) not captured by PET due to their angle, and 3) not captured by PET due to attenuation You may consider the consider the PET system to be in 2D as shown in order to simplify the problem. What fraction of positron annihilation events are not captured by this PET system due to their angle (ignoring attenuation)? 3B. i) Describe Compton scattering of X-ray photons. ii) Why does the scattered photon from Compton scattering pose a particular problem for PET imaging? 3C. The linear attenuation coefficient of 511 keV X-ray photons is 0.1 cm−1. What fraction of emitted X-ray pairs are lost due to attenuation? 4. MRI Pulse Sequences4A. Sketch and describe an inversion recovery MRI pulse sequence. Show the signals: RFin, RFout, Mz, Mxy. Show the slice selection and frequency encoding gradients, and show the times TI and TR. 4B. Consider the case where TI « TR. Briefly explain and show mathematically how the inversion recovery Mz signal is proportional to 1−2exp(−t/T1) during the interval from the 180° pulse to the 90° puslse. 4C. Using the definition of the MRI signals, explain why the inversion recovery is able to obtain much higher contrast ratios than saturation recovery. Given a background tissue region with T1 = T1,bkgnd, write an expression for the choice of TI as a function of TR and T1,bkgnd to obtain very high contrast. Last Updated: $Date: 2007-11-24 01:39:40 -0500 (Sat, 24 Nov 2007) $ |