| |
ELG7173 - Final Exam Winter 2004
You have 3 hours to complete this exam.
The exam has five questions; you are required to answer any three of them.
Each question is worth equal marks.
This is a closed book exam; however,
you are permitted to bring one 8.5" × 14" sheet of notes into the exam.
You are permitted to use a calculator.
You may not communicate with anyone during the exam except the instructor.
- X-Ray imaging System
|
|
|
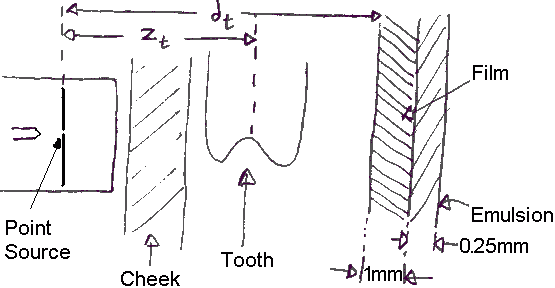
Figure 1A:
Configuration of a dental X-ray system.
|
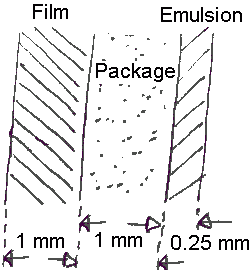
Figure 1B:
Configuration of the dental X-ray film. Due to a
manufacturing defect, the emulsion was placed on top
of a 1 mm thick packaging material.
|
A dental X-rays system uses a scintillating emulsion
film, as shown in figure 1A. Note that normally double emulsion
film is used, but this problem is simplified here.
A point source of X-rays is used, and we
are interested in imaging a cavity at the centre of the
tooth. Distances are
zt= 5 cm, and
dt= 8 cm.
The film itself is 1 mm thick and can be assumed to have
an attenuation of zero at the X-ray energy used.
A 0.25 mm thick emulsion layer with μ=20/cm is used
on the far side of the film from the X-ray source.
A certain set of dental X-rays was taken, but were later
discovered to give unusually blurry images. After investigation,
the cause was determined to be that the packaging was not taken off
the film
before the emulsion was put on, as shown in figure 1B.
Assume the packaging to be 1mm thick with
an attenuation of zero. Thus, the emulsion layer
was actually held 1 mm from the film.
-
If a cavity in the centre of the tooth has a vertical size of 2 mm on the film,
what is its actual vertical extent.
-
Explain, using diagrams as appropriate, why the manufacturing error
would cause images to be blurry.
-
Develop an equation for the detector PSF.
The following material calculates the equation for a different
scenario, and may be useful:
The normalized Fourier Transform of the PSF at the detector due to an
X-ray photon interaction at position x is
H(ρ,x) = exp(−2πxρ)
where ρ is the radial spatial frequency (in cycles / mm).
Consider a single emulsion layer of width d on the far
side of the film from the source. The probability density of
X-ray photon interaction as a function of x is:
p(x) = K1 exp(−μx)
where
K1 = μ / ( 1−exp(−μd) )
To calculate the response for the detector
H(ρ), we integrate
p(x) H(ρ,x) dx
from 0 to d. This gives:
H(ρ) =
( 1 −
exp(−K2d) )
K1 / K2
where K2 is 2πρ+μ
-
What is the relative response of the detector at for a spatial
frequency of 1 cycle / mm
as a function of the response at a spatial frequency of zero.
- Display of Medical Image Data
Consider a scenario such as described in the previous
problem, in which a set of valuable images has been
taken in which there was a defect in the equipment.
-
In some cases it is not possible to retake the images.
You are called in as a consultant to see if it is possible
to correct the blurry images. You have access to the X-ray
camera and to both correctly made and erroneous film.
Describe a procedure based on Wiener filtering
to correct the blurry images
-
The PSF of the original system and defective system
are measured. Both are Gaussian, as follows:
Original system:
h(x,y)= exp( −
(x2 + y2)/(1 mm)2)
Defective system:
h(x,y)= exp( −
(x2 + y2)/(2 mm)2)
Calculate the Wiener degradation filter HD.
-
Noise is white and Gaussian, and the defective system
has a signal to noise ratio of 10.
Calculate the Wiener restoration filter HR.
-
Would it help to apply contrast enhancement to the
Wiener restored image?
Describe why or why not
- MRI Imaging
The following Fourier transform relationship may be useful for this question:
FT{ W sinc(W t) } = rect( f / W )
-
A spin-echo pulse sequence is used in a Fourier transform
MRI imaging system.
Show a diagram of the pulse sequence with the various gradient
fields and RF pulse and RF signals.
Describe how
T2
and
T2*
can be measured from the spin-echo pulse sequence.
-
Consider spin-echo MRI to be a single input, single output system;
the input is the RF pulse and the output is the RF signal.
Is this system linear? Explain your answer.
-
In order to select a volume slice, a slice selection gradient
of 1.5 G/cm is turned on while the following RF pulse is
given in an MRI system with B0 of 1.5 T.
RF(t) = A sinc( t / 1.5 ms )
cos( B0γt )
where A is pulse amplitude (unnecessary to answer this question).
Calculate the width of the selected slice
-
In reality, it is not possible to use a sinc pulse, because it
has infinite duration. Instead, the sinc pulse limited to a
duration of T. Thus the RF pulse is:
RF(t) = A sinc( t / 1 ms )
rect( t / T )
cos( B0γt )
Calculate an expression to decribe the shape of the selected
slice. Sketch the selected slice for T = 10ms
- Nuclear Medical Imaging
Consider the SPECT system of figure 4. Six triangular
regions are defined (R1 to R6)
from which twelve projections measurements are made
(P1 to P12)
using an Anger-type camera. Each trianglular region
will emit the same number of photons in each of the
six possible directions.
P1 is aligned with collimator hole H1,
and
P2 with H2, respectively.
Holes H0,
H1,
H2,
and H3 are at x,y positions
of (0,0.0),
(0,1.0),
(0,2.0),
and (0,3.0), respectively.
Photomultiplier tubes
PMT1,
PMT2, and
PMT3, are at x,y positions
(0,−0.5),
(0,1.5),
and (0,3.5), respectively.
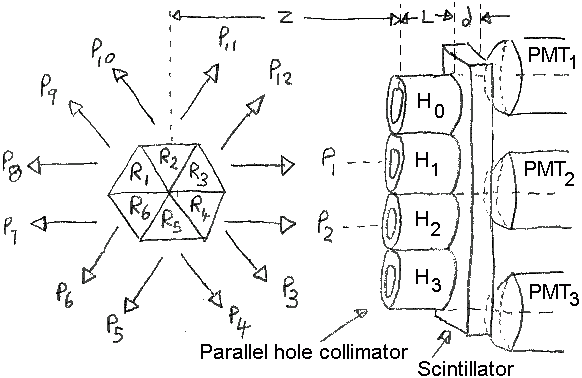
Figure 4: SPECT camera system with object
and detector
-
Why is resolution of Anger camera better than the
spacing of the detectors?
Can this approach to improve resolution be used in an X-ray system?
-
For a single SPECT event, the measured signal is
| PMT | Signal |
|---|
| 1 | 2 mV |
| 2 | 15 mV |
| 3 | 8 mV |
What is the y position of the event at the detector?
-
There are 1000 units of activity in R1.
All regions have an attenuation μ = 0.2/cm.
Consider that each region is 2 cm across (independent
of the direction of the X-ray beam). Do not consider
any attenuation of the X-ray beam in the originating
region.
Calculate the projection data
P1 to P12.
-
Using the algebraic reconstruction technique (ART),
calculate the reconstructed values in each region.
In order to decrease the time for this problem,
make the following simplification:
begin with projections P1 and make
calculations up to P6; do not iterate.
- Ultrasound
A circular ultrasound transducer of diameter 7.5 mm is
being used at a pulse frequency of 2.0 MHz to image
the breast. Assume the breast tissue is uniform with ultrasound
parameters.
c =1460 m/s,
μ = 1.6 dB/cm, and
ρ = 0.92 g/ml.
The signal interacts with a small calcified
regions with the following ultrasound parameters:
c =1900 m/s,
μ = 3.0 dB/cm, and
ρ = 1.4 g/ml.
-
At what depth z is the near field approximation no
longer valid for this transducer?
Calculate the ratio between the signal, e(t),
strength from an identical calcified region at
a depth of z=2 cm, and
at a depth of z=4 cm.
-
Show the expression for the time varying gain g(t)
appropriate for imaging of this tissue.
Consider that, instead, the time varying gain is based on
the following parameters:
c =1500 m/s,
μ = 1.0 dB/cm, and
ρ = 1.0 g/ml.
Calculate the ratio between the corrected signal,
ec(t)
=e(t)g(t),
strength from an identical calcified region at
a depth of z=2 cm, and
at a depth of z=4 cm.
-
Improved focus may be achieved using various techniques.
In class we discussed Acoustic Focusing, and
Phased arrays.
Describe one of the techniques. How does it work, and how
does it allow improved focus of the ultrasound beam?
-
Briefly describe the weakly reflecting assumption.
Why is the
weakly reflecting assumption
required in order to consider ultrasound
signal formation space invariant?
Last Updated:
$Date: 2007-03-05 10:21:58 -0500 (Mon, 05 Mar 2007) $
|