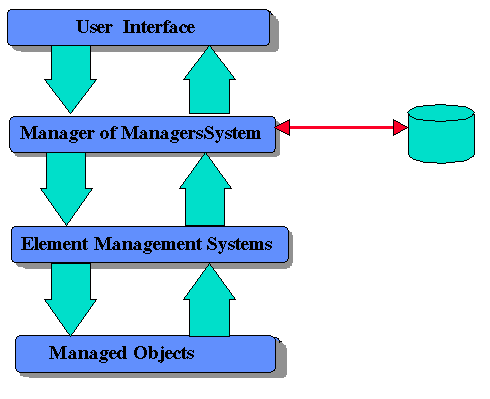
Figure 1
What it is and what it isn't.
By Douglas W. Stevenson
DStevenson@tribune.com Apr 1995
Network management systems have been in operation many years especially in their own proprietary worlds such as Netview, AT&T Accumaster and Digital Equipment Corporation's DMA. With the implementation of SNMP, local area and wide area network components could be monitored and "managed". With the vast amount of raw data available, most MIS Managers have no idea what they really want because, in part, they don't know what's available. Additionally, how does the data get into a format that actually means something? Other communications systems are considered non-manageable because they are only accessible by an RS-232 port and not by Netview or SNMP. Others tend to believe that Network Management means nothing but the monitoring and management of network architectural hardware such as Routers, bridges and concentrators -- nothing above the network layer of the OSI model is considered manageable.
What's alarming is that most Senior Network Engineers tend to be resigned to spend thousands of dollars on hardware and software BEFORE the real requirements are gathered and defined. Consequently, MIS departments either spend very little on network management or they "go for broke" with the huge hardware platforms and expensive artificial intelligence engines driving network management for the company.
In today's environment of cost cutting and productivity enhancements, most common network management implementations increase the number of people required to support the MIS functions and these new people are senior level engineering and support types; very expensive in most cases. Typical costs extend into the hundreds of thousands of dollars purchasing hardware and software not to mention the additional personnel.
Network management systems have to be geared toward the work flow of the organization in which they will be utilized. As each MIS implementation is geared toward the business requirements, so should the network management system. If the management functionality does not directly or indirectly solve a business problem, it is totally useless to the overall MIS department and to the company.
Network management doesn't mean one application with a database with some huge chunk of iron running the show. It is really an integrated conglomeration of functions that may be on one machine but may span thousands of miles, different support organizations and many machines and databases. It is these functions that must be directly driven by the business case for each.

Some examples of managed objects include routers, concentrators, hosts, servers and applications like Oracle, Microsoft SMS, Lotus Notes, and MS Mail. The managed object does not have to be a piece of hardware but should rather be depicted as a function provided on the network.
The actual data to be collected comes from the managed object, in most cases. This data is collected by the EMS systems which in turn consolidates the data in a database for processing and retrieval.
These systems components are, in turn, mapped back to what is called Management Functional Areas (MFAs). These MFAs are the wish list of which areas in which management applications as a system focus their attention.
FCAPS is an acronym explained as follows:
Fault management deals most commonly with events and traps as they occur on the network. Keep in mind though, that using data reporting mechanisms to report alarms or alerts is the best way to accomplish health checks of specific managed object's performance without having to double the amount of polling being accomplished.
Performance of Wide Area Network (WAN) links, telephone trunk utilization, etc., are areas that must be revisited on a continuing basis as these are some of the areas easiest to optimize and realize savings.
Systems or applications performance is another area in which optimization can be accomplished but most network management applications don't address this in a functional manner.
As a systems integrator, make sure the requirements are accomplished before any implementation. When the requirements are put in place, it is your job as an Engineer to make sure management is informed as to what each implementation segment will cost along with what that capability brings to the overall MIS function.
The developer of the business case must look at the current way each section accomplishes its day to day work. The case for network management can be definitized by documenting current work processes that may be automated by the system as a whole. Each of the work processes to be automated need to be documented and addressed in the system design and implementation.
Look for ways to save the organization money. Keep addressing getting the MIS organization and the services they provide, more efficient.
In a multiple site network, there are technicians, engineers and support personnel at each major location as required. No one knows those local environments better than the people having to do the work. No one knows the people of the organization better than the Help Desk staff as they are the first line of communication between the people and the MIS support organization.
Network management elements are considered, among other things, tools in which troubleshooting can be accomplished. The local support staff could benefit greatly from the use of these systems as a tool. As such, most implementations give read-only access to these systems. The ability to focus these tools at a local level is paramount to increasing the effectiveness to the local support staff. In some implementations, where read/write access is provided, it is accomplished through X-Windows which doesn't work very well across low speed links.
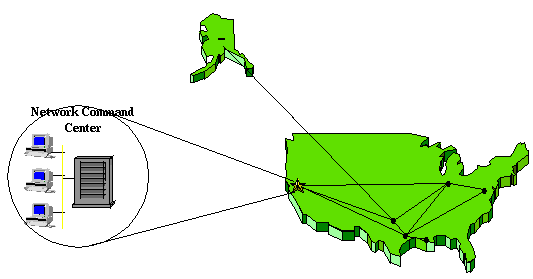
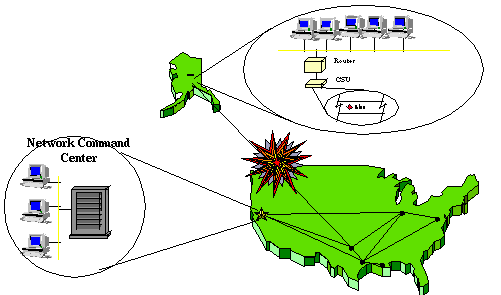
Most implementations focus these tools at a global level in that they are located in the Network Command Center. When a trouble ticket is generated from the NCC, it reflects a problem or symptom generated by the network management elements and/or the Manager of Managers. Sometimes, the local technician can not relate to this symptom because he or she doesn't understand where this message came from or why. Without access to the management element and familiarity with the product, they usually start off problem isolation in a "cloud" looking for the problem.
When a global problem occurs, in these scenarios, the information is concentrated and orchestrated by the Network Command Center. Additionally an outage can black out management of a geographic location by centralizing the management resources. Figure 3 illustrates how this occurs.
Help Desk personnel should know what is happening and who is working on what at a glance. If they are not familiar with the system in question, they should have adequate information at their fingertips to guide them in what to do, who to call, and what steps to take, even what questions to ask.
Additionally, the problems that affect other sites, should be available to those personnel at a glance. The information must be at the fingertips of the other sites' Help Desk personnel so that they know, in near real time, what is going on.
See how the focus of information should be; local when it is a local problem and global when it is a global problem. Also, the tools associated are more focused on the local situation and not the global picture.
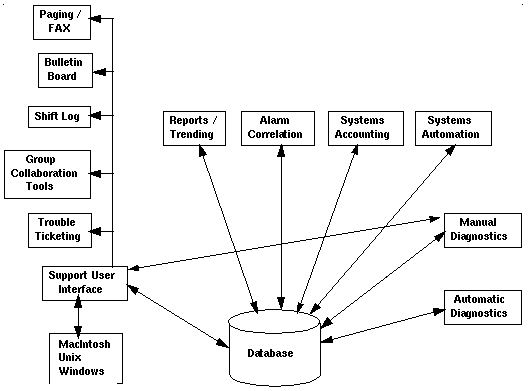
Figure 4 depicts a more distributed system providing global information with local focus. In this system, alarms can be passed from site to site and even around a problem with simple client-server database techniques.
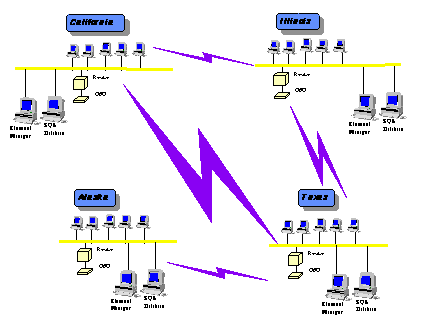
Network management across low speed wide area links doesn't really make sense. Bandwidth of this type is costly compared to LAN bandwidth in that there are the monthly charges for the links. Consider also that most WAN links are interconnected by bridges or routers. On the back side of these devices are networks capable of 10 Mbps, 16 Mbps or even 100 Mbps. On the link side you see 1.544 Mbps, 512kbps or even 19.2kbps links. Actual polling of network management elements (SNMP) could consume these links drastically reducing the operational capabilities of the link. The question to ask is Do you want to increase the bandwidth across these links just for network management or do you want to distribute the management polling to local area concentrations and just pass the real alarm information?
The personnel that should be accomplishing the trending are the people actually accomplishing the work; again no one knows the environment better than those personnel. Reporting needs to be accomplished on an as needed basis because each report needs to be in a format the local support personnel can understand. Therefore, calculations must be available to simplify data in the reports including averages, percentages and comparisons. Each type of report needs to be customizable and easy to change.
Specific areas of reporting are very useful in looking at the overall implementation. Network availability is an excellent method of looking at specific areas when implemented at a low level, i.e., by object. There are several methods in which this can be accomplished in ways that allow the IS staff to effectively manage the assets.
Most availability reports concentrate only on seeing if the box is there for a specific time period and then calculating the time not available back to the total number of time units per the month. Sometimes averages of a few objects are lumped together to produce a usable sum. The truth is, most of these types of availability reports don't do anything constructive but pacify upper management. If the data for availability focused instead on a weighted metric depicting importance of the service provided and what was actually happening during downtime, such as scheduled maintenance, unscheduled maintenance, lost connectivity due to something else failing, definitive actions could be taken to circumvent some of the problems. Effectively, network availability is an excellent tool to "raise the flag" when a specific service is becoming unreliable.
Most implementations use a network availability formula similar to the formula shown in figure 5. This formula is usually geared toward specific devices on the network or the availability of a trunk. Notice that the more devices added into the overall calculation, the more obscured the calculation becomes in that one considers all the devices on the same level as others and furthermore, the more devices added into the overall average, the more hidden they become.
This is accomplished for each device, then averaged as a group.

Another method of accomplishing availability is to gather a list of services, provided on the network, by priority. Report on the availability of each of the services on a monthly basis. Use a modifier or weighting on those services that are considered more important to the organization. Telling management the truth about the availability of services provides an avenue to correct those things that are having problems and provide better services to the end user community. In the formula figure 6, one can see how specific services can be weighed according to importance to the business units.

Another misconception in measuring response time is the use of ICMP ping statistics. Because ICMP echo requests and responses are probably dead last on the priority in which protocols are serviced on most boxes, the data collected through pings may or may not be accurate dependent upon how busy the device was at that particular instant in time. A much more accurate method of collecting valid response time data is using SunNet Manager's proxy MIB "ippath" or using traceroute which is available in the public domain.
Inversely, one can monitor ICMP Source Quenches to see if the interface is being flooded or the system can not respond quickly enough for the data coming in. This specific problem is common to Unix Servers that do not have enough swap space or are sized to small for the applications services they provide.
Some RMON devices can provide statistics on the interpacket delay between two nodes on the network. This is especially handy when monitoring protocols other than IP such as Novell's IPX/SPX.
Routers are an excellent source of echo response data provided one can script through the process with either a console port attachment or via Telnet. For example, Cisco routers can ping a device using the Appletalk protocol.
There are applications available today that will monitor applications performance on the Server. These applications typically provide an avenue to monitor an applications performance on a server and report problems. Additionally, they organize the available data associated with the actual resource utilizations so that systems personnel can keep the service at an optimum performance level.
Network utilization can be measured from SNMP based managed objects using the MIB 2 ifinput and ifoutput tables of a router, bridge or concentrator. These types of interfaces are usually considered promiscuous in that they listen for all packets regardless of destination.
Using RMON Pods, one can get excellent information concerning the utilization of the network they are attached to. Remember though, that any device that performs bridging or routing will effectively blocks utilization measurements without deploying a Pod on that specific segment. Statistics such as traffic by protocol, by node address and connection lists enable analysis of the traffic on the segment in a very detailed fashion.
While implementing a response time measurement on a LAN or WAN, it is very smart to check the accuracy of the information you are gathering. Use a good protocol analyzer such as a Network General Expert Sniffer or H-P LAN Probe.
On Wide Area Networks, some utilizations can be accomplished on some devices, usually only for devices that dynamically allocate bandwidth as required. Some high end multiplexers can provide this data. ATM Switches and Hubs definitely can provide this data usually through the ATM MIB or through an Enterprise MIB associated with the device itself.
Telephone trunk utilizations are available through most Switch and PABX vendors although not usually using SNMP. Most have a terminal interface that can be used to poll the data from. Some implementations use a Call Accounting system to record detailed utilizations of the telephone trunks and stations.
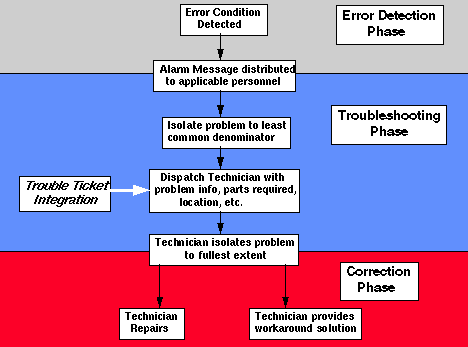
It is through this "Knowledge Base" that Mean Time To Repair (MTTR) cycles get more efficient. Think about it; a problem is detected faster, a Help Desk person sees the alarm and starts the diagnostic process, then dispatches the technician with enough information to know the most probable cause (what parts to take!) of the problem.
The actual alarm display needs to be simple and informative. By focusing these messages away from graphical depiction, distribution of the information is made much simpler -- and faster. Textual messages can even be displayed easily on a VT-100 terminal dialed into a terminal server. Another example is to pass critical alarms to a display pager, especially during off hours or weekends.
Alarm correlation is good in that it narrows the possibilities to a common denominator. Once alarm correlation is accomplished, other tasks can take place automatically such as auto-generation of a Trouble Ticket or technician paging. Even auto healing mechanisms can be initiated once alarm correlation has occurred, i.e., a redundant circuit could be brought on line while the defective link be placed in standby.
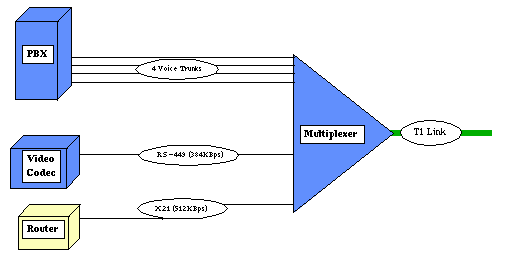
If true artificial intelligence is to be applied, most implementations leave out significant information pertinent to proper correlation. Most artificial intelligence applications deal specifically with two types of data; rules based information and heuristic information. Rules based information is that information that can be used to depict entity relationships and how those entities interact with each other. As such, most rules tables are static in nature in that one inputs the information associated with the relationships. The second type, heuristic information, is the dynamic information derived from previous conditions that have occurred.
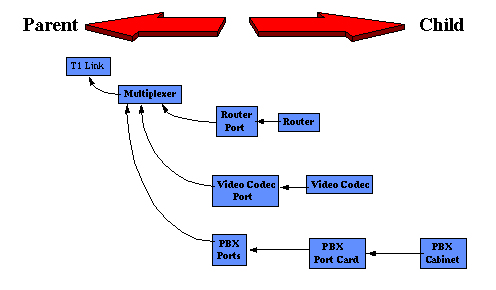
This same relationship can be accomplished in a database much simpler than the artificial intelligence based solution. The artificial intelligence based solution will provide a method of calculating, on a percentage basis, the most probable cause of the root alarm. Root alarms are those alarms that actually have something wrong. A side effect alarm is one where the alarm is caused by a failure external to the managed object. In figure 5, a failure on the T1 link actually reports alarms as follows:
Parent		Sibling		Managed Object	Address	Location	etc.
T1 Link		Multiplexer 1	0		XYZ
T1 Link		Multiplexer 2	0		ABC
Multiplexer 1	Serial1		Router 1	1.1.1.1		XYZ
Multiplexer 1	Port5		VC 1		1.1.1.2		XYZ	Video Codec
Multiplexer 1	card 25-1	PBX 1		1.1.1.3		XYZ	ACME PBX
By searching through a configuration table such as the one above, you can see how easy alarm correlation really is. By building these relationships and relating a table of active alarms back to the relationships between managed objects, it is relatively easy to narrow down to a common denominator. Simply parsing through the table looking for the highest point in the parent - child relationship yields the same result as the AI inference engine. (In a lot shorter time but minus the probability of failure calculation)
Heuristic information can also be derived provided access to alarm or symptom histories is provided to some extent.
Many network management systems in operation today, do nothing to pass information to the Help Desk - unless Engineering types are manning the Help Desk. This is where these applications really miss the boat in that they have been written by programmers and engineers without looking at the business case. Some of the programs were even written by programmers that have never had to support a network or so it seems. The real business case is that you want the Help Desk personnel to be well informed and have helpful information at their fingertips. When the actual work process flow is documented, one easily sees that key processes are handled by the Help Desk. The more informed they are, the less time is taken in getting a problem resolution on its way to be accomplished. If they have to find out what's going on and call the user back, the time taken from the time a problem has been detected to the time a technician is dispatched is increased dramatically.
The overall key to success in the operation of an MIS department is not to hire expensive high level engineers to accomplish the work. People are more motivated when they are hired and trained within the organization. This is also the most cost effective if the expertise of the organization is distributed to those lacking specific knowledge in those areas. Building a knowledge base of symptoms and the tasks associated with finding and correcting those problems just makes good common sense.
In the knowledge base, tasks such as check certain things, call this technician or page this guy or even to ask questions to gather information, places, at the fingertips of the Help Desk person, clear, definitive tasks to accomplish to get the ball rolling.
By the process of elimination, a list of probable causes can be narrowed to a single probable cause just by looking at a couple of things and asking the right questions.
Building this knowledge base and deploying it throughout the organization, enables new personnel to be productive day one. Furthermore, it takes the knowledge of all (i.e. Desktop support, Server Support, Database Support, Network Support, Unix Systems Support, etc.), collects that information in a process flow format, and distributes it to all concerned.
Data such as the number of specific models of hard drives or video cards that have been repaired or replaced over the last month, quarter or year, allow the MIS Manager to weed out those devices that cost too much to repair. Analyses of this sort typically drive the cost of maintenance down greater than 20%. Because of the rollover of technology, these things need to be monitored in that it may be more economically feasible to replace a whole desktop computer than to have a hard drive controller replaced. Best of all, the end user feels as if they are being taken care of. Consider this; the customer is happy because the service is focused toward them and money is saved because it costs less to replace that aging old box that kept breaking.
The ability to track the workload by department is an excellent tool for management to analyze the number of personnel by skill and adjusting the technicians to the work at hand. The Trouble Ticket application, if integrated with network management, provides an easy flow of work and information in tracking problems from start to analysis after the fact. The trouble ticket must integrate well into the way the people accomplish work. Focus on the business case and the work flow process.
Some trouble ticketing systems allow the technician to check inventory for a specific part while on line, generate an overnight shipping label or automatically flag an item that is low in inventory.
Trouble ticketing systems must have the ability to track Warranty and maintenance administration information in an easy to use method. So many organizations buy new equipment but do not track the Warranty information until someone raises the flag that a maintenance contract is needed on the specific type of device. If maintenance contracts do not start when warranty ends, additional charges can be expected. All of these additional costs, lost time in getting a part plus the additional 10 to 20% for maintenance contract penalties, add up to money thrown away.
One example is an MIS department that had one person spending around five hours a day checking electronic mail connectivity across Microsoft Mail and various gateways to other types of mail systems, such as SMTP, X.400, Profs, All-in-1, and CC:Mail. Wouldn't this type of work flow problem be solved easily by building an Electronic Mail poller that sent messages to echo type mailboxes across the various systems. By polling across the systems, response time and connectivity could be checked in an automated fashion. If the data associated with this system were forwarded and parsed into the Network Management application, the Electronic Mail Support person could be freed up to accomplish other tasks associated with his or her department. Only if a problem was found, would the concern arise.
In general though, these requirements need to be driven by the actual work flow processes currently in place and trying to save time and money by shortening these processes.
Groupware tools include Group Sketch or Whiteboarding, Group chat, Brainstorming, Group postit notes, group editing and the like really add to ways' people can interact. The exchange of ideas and information across departments, site and countries tend to get the whole organizations working together.
Not just alarm messages need to be passed to other affected MFD's. Alarm correlation information and automatic diagnostics are examples of other information relative to a fault that provide a better picture of what's really happening on the other end.
Perform "Dry Runs" of alarms and the diagnostic steps associated with getting the problem on the road to resolution in a quick and efficient manner. Have the appropriate support organizations participate so that all diagnostic steps can be identified and included. Don't leave out any management notifications that may be necessary.
Train the Help Desk to input troubleshooting procedure pertinent to their function into the diagnostics table. This can include anything from a user calling in with a problem with an application (i.e. MS Word), to filling out forms for a specific service to be provided to an end user.
The skills associated with the support organizations in one MFD may be
different from another MFD. The gathering of diagnostic procedures allows
a "sharing of the wealth" of knowledge across the enterprise. The
diagnostics procedures are a knowledge base of information, by symptom, of
problems and taskings and what needs to be accomplished to correct the
problem. Having the skills of Desktop Support, Unix System Support,
Network Support, etc., at the fingertips of Help Desk personnel increases
their ability to logically react to problems as their occur.
Element Management Systems, whether they are third party products such as
SunNet Manager, HP Openview, Netview 6000, Netview, NetMaster, 3M TOPAZ,
Larsecom's Integra-T, or in-house developed pollers, need to be easy to
integrate into the whole system. Recognize that in the architecture, no
EMS is really aware of another. Awareness across EMS's needs to be
accomplished at a higher layer so that the EMS's can focus on their area of
management within their MFD.
Functions such as Alarm Correlation, Diagnostics across EMS's, etc., can
be accomplished using artificial intelligence principals within a
relational database. Almost all Manager of Manager products employ an AI
Inference engine to calculate the probability that one component is so many
percent more probable to break versus another. The inclusion of the AI
Inference Engine drives up the cost because of the engine AND the iron to
run these types of calculations. These types of decisions need to be
accomplished through the support organizations within the MFD because these
folks know the local environment better than any machine or personnel at
another site. Doesn't the overall application serve it's purpose better if
it is more tightly integrated into the business units?
The application of AI still needs to be applied but at a much different
level. Network General Distributed Sniffer Servers are an excellent
application of AI technology. By analyzing the relationships of protocols,
traffic, connections and LAN control mechanisms. The DSS uses AI to sort
out problems at a very low level before they become user identifiable
problems and cause degradation or downtime.
Additionally, artificial intelligence can be used to capture the heuristics
of network behavior and help with the diagnostics. The information
available from past alarms of similar problems associated with what was
accomplished to isolate and correct the problem needs to be incorporated
into the overall system.
Additionally, because a network management system must be customized to the
local environment, there are a lot of hidden costs beyond the hardware and
software.
Look at the total picture of the entire enterprise and match what is
proposed to what's currently operational. Ask the same questions for each
site.
HTML Conversion: Jeff Murphy jcmurphy@acsu.buffalo.edu
Questions to Ask
As an MIS Manager, when you are approached by staff or vendors concerning
Network Management, there are a few key questions to ask. How much will the system cost?
A lot of systems implemented today are accomplished by a Salesman
specifying the system to the MIS Manager. They typically push huge amounts
of hardware and software at the problems at hand. Some vendors will even
tell you that cost is not important; it's the capability that counts. Will the proposed system integrate into and enhance my current MIS
support capabilities?
A lot of MIS Managers really miss the boat by not demanding that the
overall system be tightly integrated into the business units. If the
system serves no business purpose, you buying technology for technology's
sake... the system is doomed to failure. Is the proposed system modular in design?
If everything in a Network Management System is loaded on one box, you're
setting yourself up for inefficient use of computing resources. If the
system contracts, the one box will be underutilized; if it expands, you'll
be trading that box in for a bigger one... losing money every time. Is the product proposed just an Element Management System or is it an
Integrator of Element Management Systems?
Too many times, MIS Managers are sold a product like HP Openview or IBM
Netview 6000 as a Manager of Managers System. Although, some integration
functions are capable in these systems, you take away from their ability to
perform real work... like polling and gathering information. What does the system monitor?
Match the capabilities of the proposed Network Management System to the key
I/T services provided. If it is not a good match now, it won't be later. Does the proposed system enhance the capabilities of the current support staff or does it add more support staff?
Be especially careful in that some systems will do nothing to enhance your
current support staff capabilities and add five or ten more personnel to
your staff and to your budget. Not to mention, these people are usually
highly skilled specialists in Network Management... which don't come
cheap. Conclusion
There are a lot of excellent products available today that provide
capabilities to manage not just hardware, but services and applications.
The way that these systems are implemented are also critical in that each
management capability installed must match a business need for such a
system. Additionally, these diverse systems must be integrated together
and into the support organizations to achieve maximum effectiveness.
Author: Douglas W. Stevenson