DEVSView Manual
Introduction
DEVSView provides services for visualizing simulations. The simulations it has direct support for visualizing are discrete visualizations developed from the Discrete EVent Systems (DEVS) specification. DEVSView reads log files created by CD++ simulations and provides a couple facilities for visualizing the results.
The reasons for using DEVSView are for the flexible method of visualizing the results. Using the visual state transition system and the event animation system you can specify what results you think are important to visualize. Visualizations in DEVSView are hardware accelerated using OpenGL.
Installation
ZIP file
Extract the DEVSView zip file to the directory of your choice. Copy any previously created visualization files (.vis) to this directory for viewing.
Source Code
The DEVSView source code comes with a solution file for Microsoft Visual Studio .NET 2003. Extract the source code zip file to the directory of choice and open the DEVSView.sln file to open the solution.
First visualization
The following is a step by step tutorial for creating a visualization in DEVS. This tutorial shows the steps required to create a visualization of a CD++ simulation which shows 3 balls bouncing in a 2d grid. The bounceLOG.log and bounceMA.ma files are included in the DEVSView zip file download.
1) Copy the bounceLOG.log and bounceMA.ma file from the bounce simulation directory to the DEVSView directory.
2) Run DEVSView.exe. If the console is not already open, open it by pressing ~ or clicking on the console button.
3) Create a new visualization by entering the command ‘vis_new bounce’
4) Import the log file by entering the command ‘vis_import_logfile bouncelog.log’
5) Import the .ma file by entering the command ‘vis_import_mafile bouncema.ma’
6) Verify the events were loaded correctly. Enter the command ‘print VIS_EL’, you should see the list of the events loaded from the log file.
7) Verify the model was loaded correctly. Enter the command ‘print VIS_ML’, you should see the Cell-DEVS model rebota listed, with the dimensions (16, 20, 1), input ports: /initial and out, output ports: out, neighbourchange
8) Save the file as bounce by entering the command ‘vis_save bounce’
9) Open the file bounce.vis in wordpad (it handles the end of lines better than notepad).
10) Verify the file has the blocks described in Appendix C
11) Search for ‘CellSpaceSize’ and set the values of ‘X’, ‘Y’, and ‘Z’ in the complex block to 25.0, 25.0, and 1.0 respectively. The result should look like this:
{CellSpaceSize
{X F 25.0 }
{Y F 25.0 }
{Z F 1.0 }
}
12) Search for ‘Label’ and the set the value of ‘Label’ to ‘}0’ (The ‘}0’ sequence is equivalent to an empty string). The 3d text drawing implementation is currently too slow to use with a large cell space, so erasing the label speeds up the program significantly. The result should look like this:
{Label S }0 }
13) Save the file and return to DEVSView
14) Load the bounce visualization file by entering the command ‘vis_close’ followed by ‘vis_load bounce’
15) Click on the Models button in the toolbar. Select the rebota model and click on the ‘Edit…’ button.
16) Click on the ‘Add…’ button next to the visual state list. Erase the label of the visual state in the Visual state edit panel that pops up. Set the color of the visual state to red (Red=1.0,Green=0.0,Blue=0.0)
17) Select the first visual state in the list (The one that you didn’t just set to red). Click on the ‘Edit…’ button next to the visual state list. Set the colour of this visual state to a dark grey(Red=0.1, Green=0.1, Blue=0.1)
18) Add a transition rule by clicking on the ‘Add…’ button next to the transition rule list.
19) Select S2 in the ‘Go to State’ list. Select ‘Any’ from the ‘If in State’ list. Select ‘out (O)’ (the O means its an output port) from the port list. Select the ‘Range of Values’ option from the ‘If this rule is triggered’ list. For the lower value select 0.01, for the upper value select 20.0. This creates a rule which transitions the cell visual state from black to red whenever a cell outputs a value from 0.01 to 20.0. A cell space is occupied by a ball if its number is greater than 0.
20) Add another transition rule, which transitions from S2 to S1 if the cell outputs a value of 0.0 on the ‘out (O)’ port.
21) Save the visualization
22) Close the Model edit panel and the model list panel. Click on the Run button in the toolbar.
23) Use ‘W’, ‘A’, ‘S’, ‘D’ to move the camera. Left click on the window and drag the mouse to rotate the camera. 'W' moves the camera forward, 'S' moves the camera backward, 'A' moves the camera left, and 'D' moves the camera right.
24) Press play to view the visualization. You should see an animation similar to this:
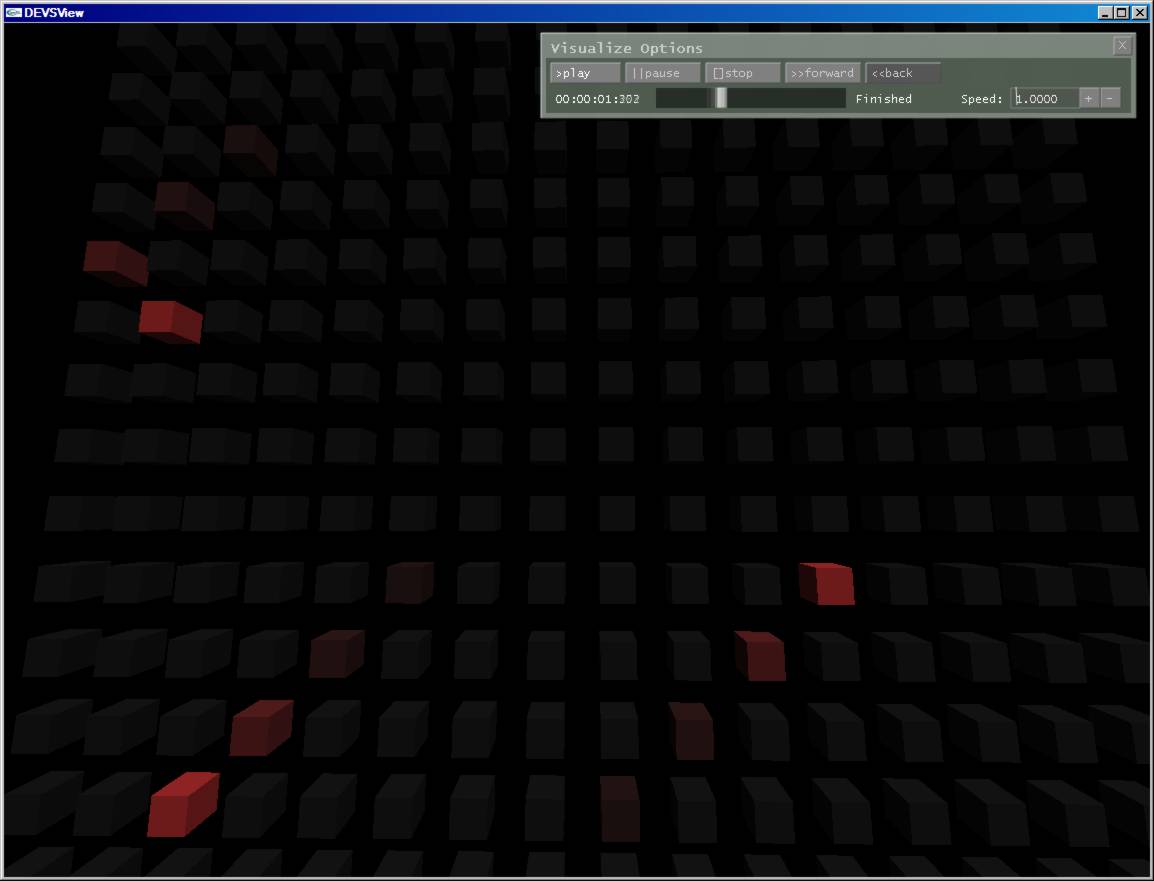
Figure 1: Bounce visualization.
User Interface
The user interface starts up in the following state shown in Figure 2.
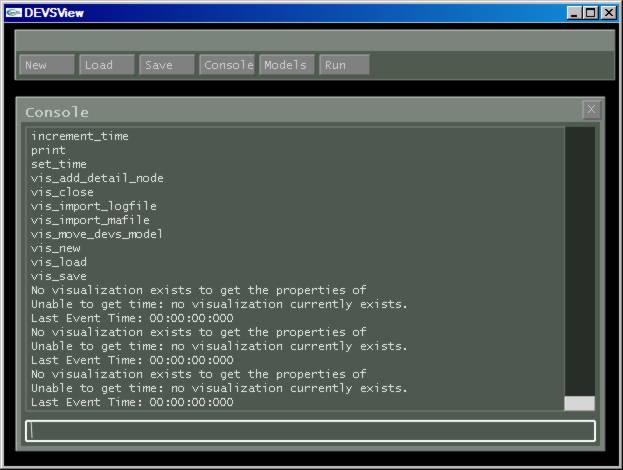
Figure 2: The main window starting windows. The toolbar shown at the top and the console shown in the bottom.
The console shows the results of previous commands and the information produced from common DEVSView tasks. These tasks include visualization playback (i.e the visual state transitions are logged). The console supports tab completion, and command listing. Simply press tab to get a list of commands available from the console.
The toolbar contains common commands for manipulating visualizations. The 'new' button creates a new blank visualization. The 'load' and 'save' button prompts the user for an existing visualization name and loads/saves that file to the harddisk. The visualization files are stored in the DEVSView directory. The Console button toggles the display of the console. The Models button toggles the display of the models list panel which is shown in Figure 3. The 'Run' button enters DEVSView into playback mode for the current visualization. This mode is shown in Figure X.
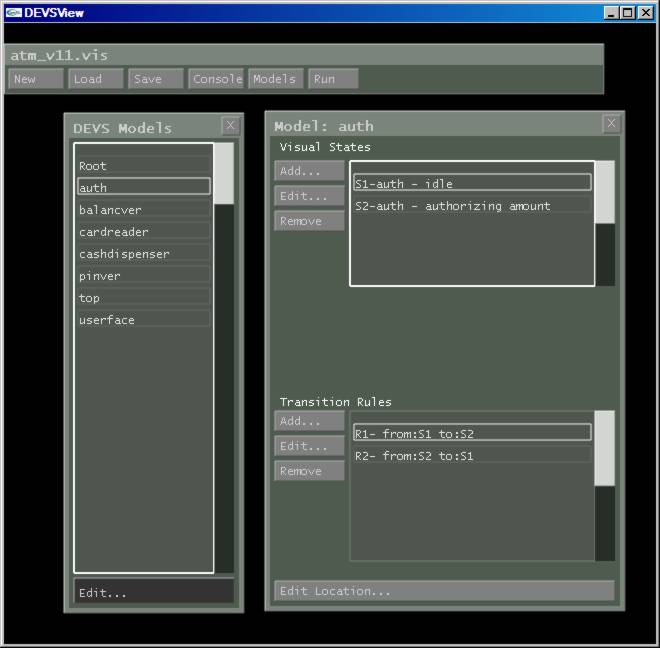
Figure 3: The 'DEVS Models' list panel which contains all the visual models and a Model edit panel showing the contents of the 'auth' model.
The model list panel contains a list of all the visual models parsed from the two sources: 1) CD++ .log files and 2) .ma files. The model selected can be edited by pressing the 'Edit..." button located at the bottom of the panel. Pressing the 'Edit...' button brings up the panel shown on the bottom right in Figure 3. This panel is the model edit panel and lists the visual states and transition rules for the model. The location of the model can also be edited using the 'Edit Location...' panel. The visual states and transition rules are managed in this panel, but the actual properties of the visual states are edited in the panels shown in figure 4 and 5 respectively. These panels are displayed when the 'Edit...' buttons for the visual states/transition rules lists are pressed and their is a valid visual state/transition rule selected.
![]()
Figure 4: Transition rule edit panel.
The transition rule edit panel provides the controls for setting up how the visual model transfers from state to state. The 'Go to State' is the destination state. The 'If in state' is the source state. The 'If value received on port' list specifies the port required for this transition to happen. The 'If this rule is triggered' section specifies the rule type and any properties that that rule contains. In Figure 4, the value rule 'Equals Value' is selected and the value 1.0 is chosen. This means this rule will only be triggered if the value in an event is equal to 1.0.
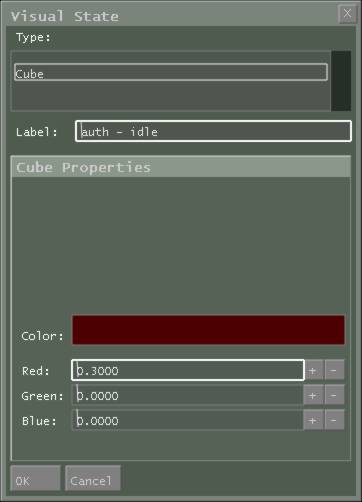
Figure 5: Visual state edit panel.
The visual state edit panel consists of controls for selecting the type of the visual model and then the label for the visual model. The properties such as colour (which is shown in figure 5) depend on the type of visual state specified. The label will always be present and should be left blank if no label is desired (for large cell models the label causes a large delay in the rendering). With a cube visual state, you can specify the colour of the cube.
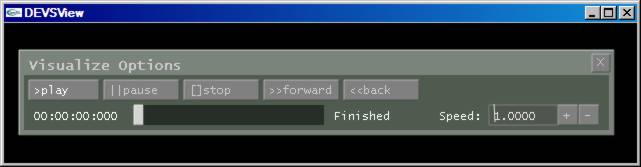
Figure 6: The visualize playback panel
If the user presses the 'Run' button from the main window toolbar, DEVSView closes all other panels and enters visualization mode. This mode has only the panel shown in figure 6. The user can then view the visualization using the buttons shown, 'Play', 'Pause', 'Stop', 'Forward', and 'Backward. In addition the user can drag the slider to the appropriate spot in the visualization to view that part. The speed of the visualization playback is control by the time scaling factor in the 'Speed' number selector. A value of 2.0 would mean twice as fast as real time, and a value of 0.5 would mean twice as slow.
Visualization File format (.vis extension)
The file consists of blocks of information. Each block may contain one or more blocks or it may be basic block which simply contains a basic C++ type.
In the following descriptions:
- ‘$’ indicates a variable string which contains no spaces.
- ‘Left || Right’ indicates a choice between two options
- ‘…’ indicates the contents of a complex block repeats.
- ‘---‘ indicates the contents of a complex are defined elsewhere.
All blocks begin with ‘{$BlockName’ and end with ‘}’.
Basic Blocks
Example Basic Blocks:
{Name S TestName}or
{Age I 86}or
{Probability F 0.5}Each basic block is of the form:
{$VariableName $Type $Value}$VariableName is a sequence of characters without spaces.
$Type is one of the following single characters:
‘S’ – a string type
‘I’ – a signed integer
‘U’ – an unsigned integer
‘F’ – a single precision floating point number
‘D’ – a double precision floating point number
‘B’ – a Boolean value
Depending on the value of $Type, the contents of $Value may follow different formats.
If $Type = ‘S’
$Value = A sequence of characters without a space. A ‘}’ followed by a ‘_’ is a special sequence for indicating a space. Two sequential ‘}’ characters are converted to a single ‘}’.
If $Type = ‘I’
$Value = Any string capable of being converted to an integer using the ANSI C sscanf method.
If $Type = ‘U’
$Value = Any string capable of being converted to an unsigned integer using the ANSI C sscanf method.
If $Type = ‘F’
$Value = Any string capable of being converted to an single precision floating point number using the ANSI C sscanf method.
If $Type = ‘D’
$Value = Any string capable of being converted to an double precision floating point number using the ANSI C sscanf method.
If $Type = ‘B’
$Value = ‘F’ for false, and ‘T’ for true.
Complex Blocks
Complex blocks contain other simple or complex blocks.
Example Complex Blocks:
{Color {Red F 0.5} {Green F 0.5} {Blue F 0.2}}or
{Car {Type S Schmord}_Boxcar} {Wheels U 4} {Doors U 2}}
Each complex block is of the form:
{$BlockName
… SubBlocks …
}
Visualization File Format:
The visualization file consists of a complex block named ‘Visualization’. The ‘Visualization’ block consists of the basic block ‘Version’ of type float. The other blocks ‘ModelList’ and ‘EventList’ consist of ‘Model’ and ‘Event’ complex blocks.
{Visualization
{Version F $Version }
{ModelList
{Model
---
}
…
}
{EventList
{Event
---
}
…
}
Model Block Format:
The model block contains a visual model. The model ‘Type’ string can either be Normal or Cell. The ‘ModelProp’ block specifies the properties of the visual model. These include the ‘Id’ string, the ‘NextRuleId’ unsigned integer (which should be one greater than the last transition rule id), the ‘NextStateId’ unsigned integer(which should be one greater than they last visual state id), the ‘NextEAFId’ unsigned integer(which should be one greater than the last event animation factory id), the ‘Position’ vector, the “InputPorts” list of strings, the “OutputPorts” list of strings, and the visual states, transition rules, and the event animation factories.
{Model
{Type S Normal || Cell}
{ModelProp
{Id S $Name }
{NextRuleId U $NextRuleId }
{NextStateId U $NextStateId }
      {NextEAFId U $NextEventAnimationFactoryId
}
{Position
{X F $XCoord }
{Y F $YCoord }
{Z F $ZCoord }
}
{InputPorts
{InputPort S $PortName }
…
}
{OutputPorts
{OutputPort S $PortName }
…
}
{VisualStateList
{VisualState
---
}
…
}
{TransitionRuleList
{TransitionRule
---
}
…
}
{EventAnimationFactoryList
{EventAnimationFactory
---
}
…
}
}
}
Visual State Block Format:
The Visual state block defines a visual state for a visual model.
{VisualState
{Properties
{Id U $StateId }
{Label S $StateLabel }
{Type S ColoredCube || Formula }
{Variables
---
}
}
}
If the value of ‘Type’ is ColoredCube the ‘Variables’ complex block is defined as:
{Variables
{Color
{R F $RedValue}
{G F $GreenValue}
{B F $BlueValue}
}
}
where each red, green or blue value ranges from 0.0 to 1.0.
If the value of ‘Type’ is Formula the ‘Variables’ complex block is defined as:
{Variables
{Formula S $Formula}
}
where the formula is a standard text string which can include printf style %f to display the event value which triggered the entry to the visual state.
Transition Rule Block Format:
The Transition rule block defines a transition rule for a visual model. Depending on the type of the ValueRule there may be other values defined in the ValueRule complex block.
{TransitionRule
{Properties
{DestinationState U $StateId }
{Id U $RuleId }
{PortDirection U 0 | 1 }
{PortName S $PortName }
{StartState U $StateId }
{ValueRule
{Type S $ValueRule }
}
}
}
For the ‘PortDirection’:
0 = Input
1 = Output
Other Value Rule Block Formats:
{ValueRule
{Type S Equals}
{Value D $Value}
}
or
{ValueRule
{Type S Range}
{HigherVal D $Value}
{LowerVal D $Value}
}
Event Animation Factory Block Format:
This block specifies an event animation factory for a visual model. The only factory type currently supported is the Text type. The following complex block corresponds to the block which defines a text event animation factory.
{EventAnimationFactory
{Properties
{Type S Text }
{Id U $AnimationFactoryId }
{PortName S $PortName }
{PortDirection U 0 | 1 }
{Source S $SourceStateId }
{AnimationLength D $Length }
{ValueRule
{Type S $ValueRuleType }
}
{Formula S $Formula }
{Start
{X F $StartX }
{Y F $StartY }
{Z F $StartZ }
}
{End
{X F $EndX }
{Y F $EndY }
{Z F $EndZ }
}
}
}
Event Block Format:
The events are defined in the ‘EventList’ list. They can either be ‘Ext’ (External) or ‘Out’ (Output) events. The time is specified in the ‘Time’ complex block. The time string is of the format “HH:MM:SS:mmm” where H = Hours, M = minutes, S = seconds, and m = milliseconds.
{Event
{Type S Ext || Out }
{Time
{Val S $TimeString }
}
{Src S $SourceModelName }
{Port S $PortName }
{Val D $ValueSent }
{Dest S $DestModelName }
}