You may make assumptions to simplify the problems as long as they
don't change the calculations by more than 10%.
You may use the following conditions and equations for your calculations:
1.
X-ray Computed Tomography
A Computed Tomography system can be represented in terms of a matrix
inverse. In order to simplify the problem, the body is divided
into four square regions, R1 .. R4, with 2 cm sides, as shown
in figure 1A. Projections P1 .. P6 are
defined such that each projection goes through two
regions. Assume that the width of each region is 2 cm, independent
of the direction of travel of the X-rays.
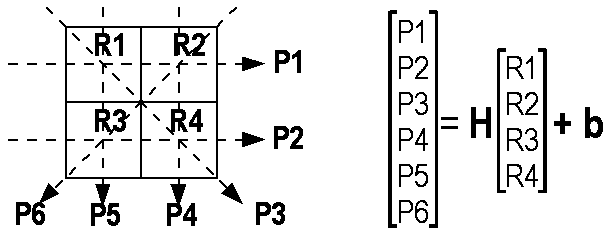
Figure 1A:
Left: Diagram of simple X-ray CT system.
The target area is divided into four square regions, R1 .. R4. Each region
has 2 cm sides. Six projections, P1 .. P6, are defined, such that
P1 travels through R1 and R2.
Right: Matrix formulation of the projection data as a function
of region attenuations.
1A.
Each projection has 108 X-ray photons per second,
with all photons having 1 keV energy.
We define each projection, P1 .. P6, as the natural logarithm of the
received beam power. Each region, R1 .. R4 is the value of the attenuation,
μ, in cm−1.
Given R1=0.5 cm−1,
and R2=R3=R4=0. Calculate P1 and P2.
1B.
Calculate the matrix H and vector b.
1C.
The matrix inverse to calculate the vector of regions, R, from
the vector of projections, P, is
R = (HtH)−1
Ht
(P-b)
The expression R = Ht (P-b)
represents simple (unfiltered) backprojection.
What does the term (HtH) represent?
1D.
Given the following projection data:
P2=P3=P4=−18.95, and P1=P5=P6=−17.95.
Calculate the reconstructed region values using the
matrix equation in the previous question.
You may wish to use the following matrix equality
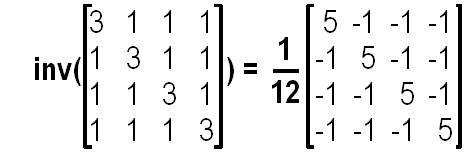
1E.
Human Visual System:
Many radiologists were reluctant to move away from
using film to computer monitors. This resistance
has been overcome somewhat with newer high
contrast high intensity monitors.
How do such monitors help radiologists?
2.
Positron Emission Tomography
2A.
Collimation:
Describe the difference between
electronic collimation and
physical collimation
in terms of mechanical design and efficiency.
Categorize PET and SPECT collimation strategies.
2B.
Efficiency (PET):
In class we defined the efficiency of a nuclear medical imaging system as
the fraction of the radiation emitted during an interval that is captured
and processed by the imaging system.
Consider a PET system with 3D collimation imaging the heart
(which we can consider to be a sphere of 10 cm diameter
at the centre of the field of view.)
The detector ring is 1 m in diameter with a z-direction
width of 30 cm. Assume the individual PET detectors are
100% efficient, and γ-rays are not attenuated by the body.
What is the efficiency of this system?
2C.
Efficiency (Pinhole camera):
Instead of a PET imager, a pinhole camera based nuclear
medical imaging system is now used. The pinhole is
2 mm in diameter placed on the body surface, 10 cm
from the centre of the heart. Assume all photons
which enter the pinhole are captured.
What is the efficiency of this camera?
Hint:
You can make simplifying assumptions, since the required accuracy is 10%.
2D.
Coincidence:
A new detector technology is invented for PET which allows
the difference in timing of coincidence events to be measured
to an accuracy of 1 ns.
Describe how such information can be used to improve PET image
reconstruction.
Specifically, describe in general terms how backprojection
reconstruction could be modified to use this information.
2E.
Attenuation:
Why is attenuation correction important for PET
image reconstruction?
In class we discussed three methods to estimate the data
necessary for attenuation correction.
Describe one method to estimate attenuation.
3.
Magnetic Resonance Imaging
Consider a MRI system imaging the head (assumed to be
a cube of 10 cm × 10 cm × 10 cm)
with the following parameters:
B0= 1 Tesla,
Gx= Gy= Gz= 4 Gauss/cm.
The RF pulse envelope is rectangular. To simplify, assume
a rectangular pulse of width T has a width of
1/T in the frequency domain.
3A.
What is the bandwidth of the MRI output signal from
the field of view that includes the head?
What is the length of the phase encoding pulse,
TGφ, in order for the maximum phase
difference across the head to be 360°?
3B.
What is the length of the RF pulse
TRF, in order for the selected slice width
to be 2 mm?
Assume a rectangular RF pulse envelope.
Given the RF pulse time,
what is the RF pulse magnetic field strength to
induce an inversion (ie. 180°) of the nuclear magnetization?
3C.
Consider that T2* is 20 ms.
Using the 90°−FID pulse sequence,
each MRI RF signal is recorded for 3 times T2*
before a new pulse sequence can be started (in order to prevent
interference between the signals from two pulse sequences).
If TR is 1.2 s, how many volume imaging
pulse sequences can be done in each TR interval.
3D.
Sketch the inversion-recovery pulse sequence for
very large TR.
The time between the 180° and 90° RF pulses is TI.
Show how the signal from the inversion-recovery pulse sequence is
ρ*(
1−2×exp(−TI/T1) )
for large TR.
Note:
This question does not require a proof; illustrate
how this value is calculated.
3E.
If two tissue regions differ in T1, show how (theoretically)
the inversion-recovery pulse sequence can generate a larger contrast
than the spin-echo pulse sequence.
Given signals s1 and
s2, define the contrast, c, as
c=(s1−s2)/s1.
4.
Ultrasound
We want to make ultrasound images of the eye (which
we consider to be a sphere of 2 cm diameter).
Assume a uniform velocity of sound in the eye of 1480 m/s.
A 10 MHz ultrasound transducer is used. At this
frequency the attenuation is 7 cm−1.
4A.
What is the smallest diameter of ultrasound transducer
in order for the eye to be entirely in the near field?
What is the advantage of a smaller diameter ultrasound
transducer?
4B.
What problem does time gain correction,
g(t), solve?
In this case, the gain correction uses
c= 1500 m/s and attenuation 5dB/cm.
What is the ratio between the gain for sound
reflected from 1 cm deep and that
from sound reflected from 2 cm deep?
4C.
One common feature in ultrasound images is
speckle noise.
Explain briefly the origin of speckle noise.
Why is there no speckle noise in X-ray images?
4D.
In this question we are interested in the combined effect of
speckle noise, Nspeckle, and
electronic noise, Nelectronic.
Nelectronic is constant, while the signal
decreases with depth (assume the near field goes to
4 cm).
Assume these noise sources are
independent, and thus add as
(Ntotal)² =
(Nspeckle)² +
(Nelectronic)².
The SNR due to speckle is 1.91. The
SNR due to electronic noise is 1.0 at a depth of 4 cm.
At what depth into the tissue does the overall
SNR reach 1.0?
Assume that the reflective tissue is uniformly distributed
in the tissue. This means that you don't need to calculate
reflectivity in the solution.
Hint: You may want to plug in values in the
calculator. Recall that the required accuracy is 10%.
4E.
List two challenges in interpreting
mode B ultrasound images.
Discuss one technique for feature identification
that can overcome a challenge described in the previous
question.
You may choose discuss a technique described in
Richard Youmaran's presentation in class.