Isaacson, D., J.L. Mueller, J.C. Newell and S. Siltanen. "Reconstructions of chest phantoms by the d-bar method for electrical impedance tomography." IEEE Trans Med Imaging 23(7): 821-828, 2004.
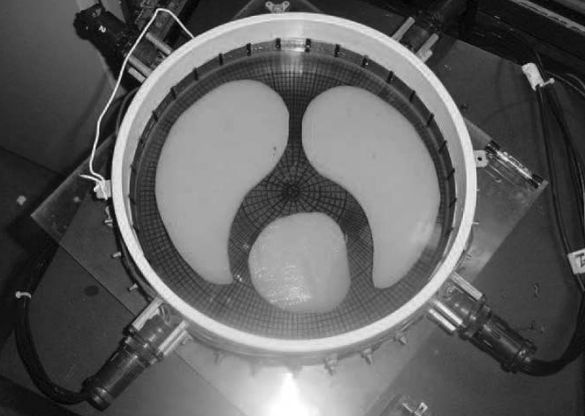
Figure: Phantom Image (from Isaacson et al, 2004)
| Authors: | Jon Newell, David Isaacson
|
|---|---|
| Date: | 2004 (Publication)
|
| Brief Description: | Measurements in 2D circular tank with chest shaped
conductivity targets in calibrated
phantom at Rensselaer Polytechnic with ACT 3 EIT system.
|
| License: | Creative Commons Artistic License (with Attribution)
|
| Attribution Requirement: | Publications based on these data must reference the
following publication:
Isaacson, D., J.L. Mueller, J.C. Newell and S. Siltanen. "Reconstructions of chest phantoms by the d-bar method for electrical impedance tomography." IEEE Trans Med Imaging 23(7): 821-828, 2004. |
| Format: | Data are in *txt files encoded this zip file
|
| Methods: | Circular Medium.
32 Electrodes numbered counterclockwise, with electrode #1 at right
(just before 3 O'Clock).
Figure: Phantom Image (from Isaacson et al, 2004) |
| Data: | Data (zip format)
|
There are five files provided in this collection, together with these instructions. They consist of one file of excitation currents, two voltage files of a homogeneous tank and two voltage files with agar targets placed in that tank shortly thereafter. The two voltage files in each case consist of a set of real voltages and a set of quadrature voltages. The nomenclature is ACT2006i.txt denotes the homogeneous tank, and ACT2000i.txt denotes the tank with targets. I=r are real voltages, i=q are quadrature.
The system used to produce these data is ACT 3, as described in:
The format of all five of these files is the same. The voltage files have a single first line that denotes the maximum amplitude of the applied currents. The next 992 lines follow the same format as the 992 lines in the current file. The current file is called ssoout1.dat, a name invented by Steve Simske in the late 1980's. The following description applies to the common format. There are 992 lines (=32×31). There are 32 electrodes and 31 current patterns. The electrodes are numbered consecutively from the +x axis counterclockwise, 32 is on the +x axis. The first 32 lines in the file constitute the first current pattern, and they specify the currents on the 32 electrodes. They are given by I = cos (θ). The next 32 lines are pattern 2, and may be described as I = cos (2×θ). What follows are current patterns up to I = cos (16×θ). That takes 32×16=512 lines. At line 513, a new pattern begins given by I = sin (θ). This continues for 15 patterns, from I = sin (θ) to I = sin (15×θ). There are thus 31 (orthogonal) patterns of applied current. A more rigorous definition of the applied current patterns is given in Eqn. 12 in the paper cited below.
The agar targets in ACT2000 resemble two lungs and a heart. The physical properties of the tank and the phantom are as reported in
It is possible to use this data, measured with Trigonometric current patterns, to computationally synthesize data that could in theory result from other current patterns, such as the adjacent pair excitation, or opposite pair excitation. In doing so, the synthesized data would have greater accuracy, distinguishability, and information about the conductivity inside the body, because it would have more digits and less error, than would be expected from a data acquisition system that applied and measured these other current patterns directly. This is because the trigonometric patterns have more information about the conductivity in their measured digits or bits than the other patterns would typically contain in the same number of measured digits or bits. The synthesis process uses many more digits than the measuring process and thus the information in the trigonometric patterns can be transferred to many more digits of the synthesized data than would typically be able to be measured by systems using these other patterns of currents directly. This is a subtle point, since the principle of superposition does not hold when finite precision arithmetic is used, but it motivates our use of ACT type systems. For this reason caution should be used in comparing the results from different reconstruction algorithms and systems, recognizing that these synthesized data sets might have misleadingly low errors. A further discussion of this point may be found in
For a more comprehensive bibliography of our work, with further discussions of these points, visit: www.rpi.edu/~newelj/eit.html −> Publications −> Full Publications
Last Modified: $Date: 2017-02-28 13:12:08 -0500 (Tue, 28 Feb 2017) $ by $Author: aadler $