- SNR
- Accuracy
- Reciprocity Accuracy
- File name:data_analysis.m
- Usage:[snr, accuracy,sym_err]= data_analysis(Reshape); For example,[snr, accuracy,sym_err]= data_analysis(0)
Reshape is a status/input parameter used to check if reshape of signal from U-shape to plateau signal shape is needed or not - 0 not needed, 1 needed. To perform data analysis, the measurement sequence may need to be rearranged to be consistent with the presentation of the results. Measured and simulated voltages need to have plateau signal shape form for ease of analysis as figure (A) (to get plateau signal shape). If the voltage sequence is based on U-shape signal (the Sheffield measurement sequence or the sequence of measurement followed by the injecting electrodes) as figure (B) or , the algorithm will reshape the signal using U2plateau.m.
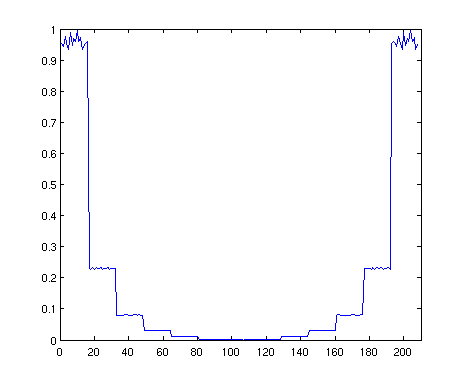
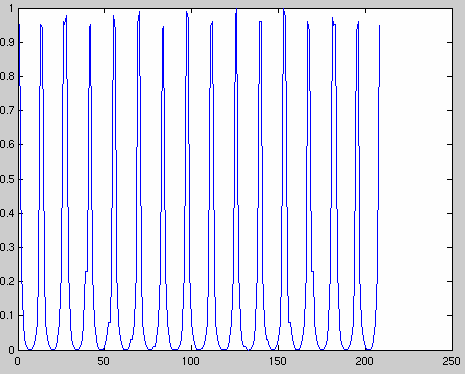
Figure (A): Plateau shaped signal,(B) U-shape signal
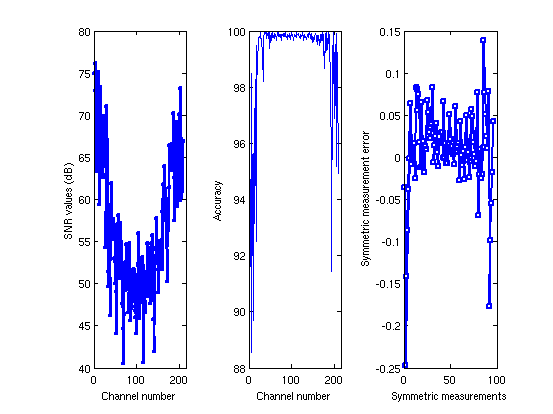
Figure: (A) SNR values, (B) Accuracy, (C) symmetric measurement error
- File name: drift_analysis.m
- Usage:[Df]=drift_analysis
Users have to check several parameters if it matches what they measured to the default values that are defined in the code like number of frames, number of data points for each frame, and measurement sequences. Input: nframes is the number of frames for drift measurement; nmeas is number of measurements for each frame (mostly 208, in some cases 416). The output value is the values of Allan variance.
- File name : image_analysis.m
- Usage: [DET, greit_para] = image_analysis, this function computes and plots following measures as output:
- Detectability
- Distinguishability
- Amplitude response (AR)
- Position error (PE)
- Resolution (RES)
- Shape deformation (SD)
- Ringing (RNG)
To have a measurement sequence with a plateau signal shape please look at Figure 10 of paper source: Gagnon H, Cousineau M, Adler A, Hartinger A 2010 A resistive mesh phantom for assessing the performance of EIT systems {\em IEEE T Biomed. Eng.} 57 (9):2257--2266, 2010.
- U2plateau.m converts Sheffield voltage measurement sequence (input) to plateau shape (output) described above.
- Usage: [Vp]= U2plateau(V)
- V should be based on U-shape (Sheffield voltage measurement sequence or the measurement sequence followed by the injecting electrodes), produce plateau shaped wave form (Vp)